RFCx.org
UI/UX Designer · 2016–2017
Design Systems, User Interface Design, Web Design
Rainforest Connection (RFCx) is a non-profit that offers a real-time monitoring system for protecting and studying remote ecosystems. I collaborated with the engineering team on a range of products, including the incident and wildlife detection dashboard, the ranger alert and dispatch portal, the AI training platform, as well as the iOS app for streaming real-time audio from rainforests around the world.
Background
In 2016 I was introduced to Topher White, the founder of RFCx.org. By that time, Topher’s Ted Talk had already gone viral, and his non-profit was racing to deliver on the promise it had been founded on: the ability to reuse old cellphones as surveillance devices protecting rainforests around the world. The key part of that promise was not only the ability to detect illegal activity, such as logging or poaching, but also to provide local communities with the tools to act on this information in real-time. I joined the team in August 2016 as a volunteer but soon after transitioned to a contractor role as the fledgling startup acquired more funding.
Design Process
When I joined, the engineering team had already built a working prototype of the monitoring system. The user interface was necessarily crude and incomplete, only used as the testing ground for the technologies under development. It used off-the-shelf styles and components from the Bootstrap framework on the front-end and needed improvements in both usability and presentation. I partnered with the VP of Engineering to turn this rough prototype into a product the company could ship to pilot users, starting with wireframe design and moving to visual design shortly afterwards.
Design Exploration
We kicked off the project by exploring the core data visualization functionality. The goal was to understand what types of data our pilot users needed to see, what controls they would need to interact with this data, and to identify any edge cases they might encounter.
While functional, the initial concept had one significant limitation: users couldn’t view different charts side by side. This was problematic because rangers needed to correlate acoustic detections with specific geographic locations in real time to dispatch teams effectively. I believed the real value of the system lay in being able to see where detections were taking place and how this changed over time, so I explored ways to integrate bioacoustic and geospatial data visualizations on a single page.
The integrated dashboard approach we eventually landed on allowed users to spot patterns that weren’t visible when viewing data in isolation, such as identifying logging hotspots or tracking detection patterns across the monitored area over time.
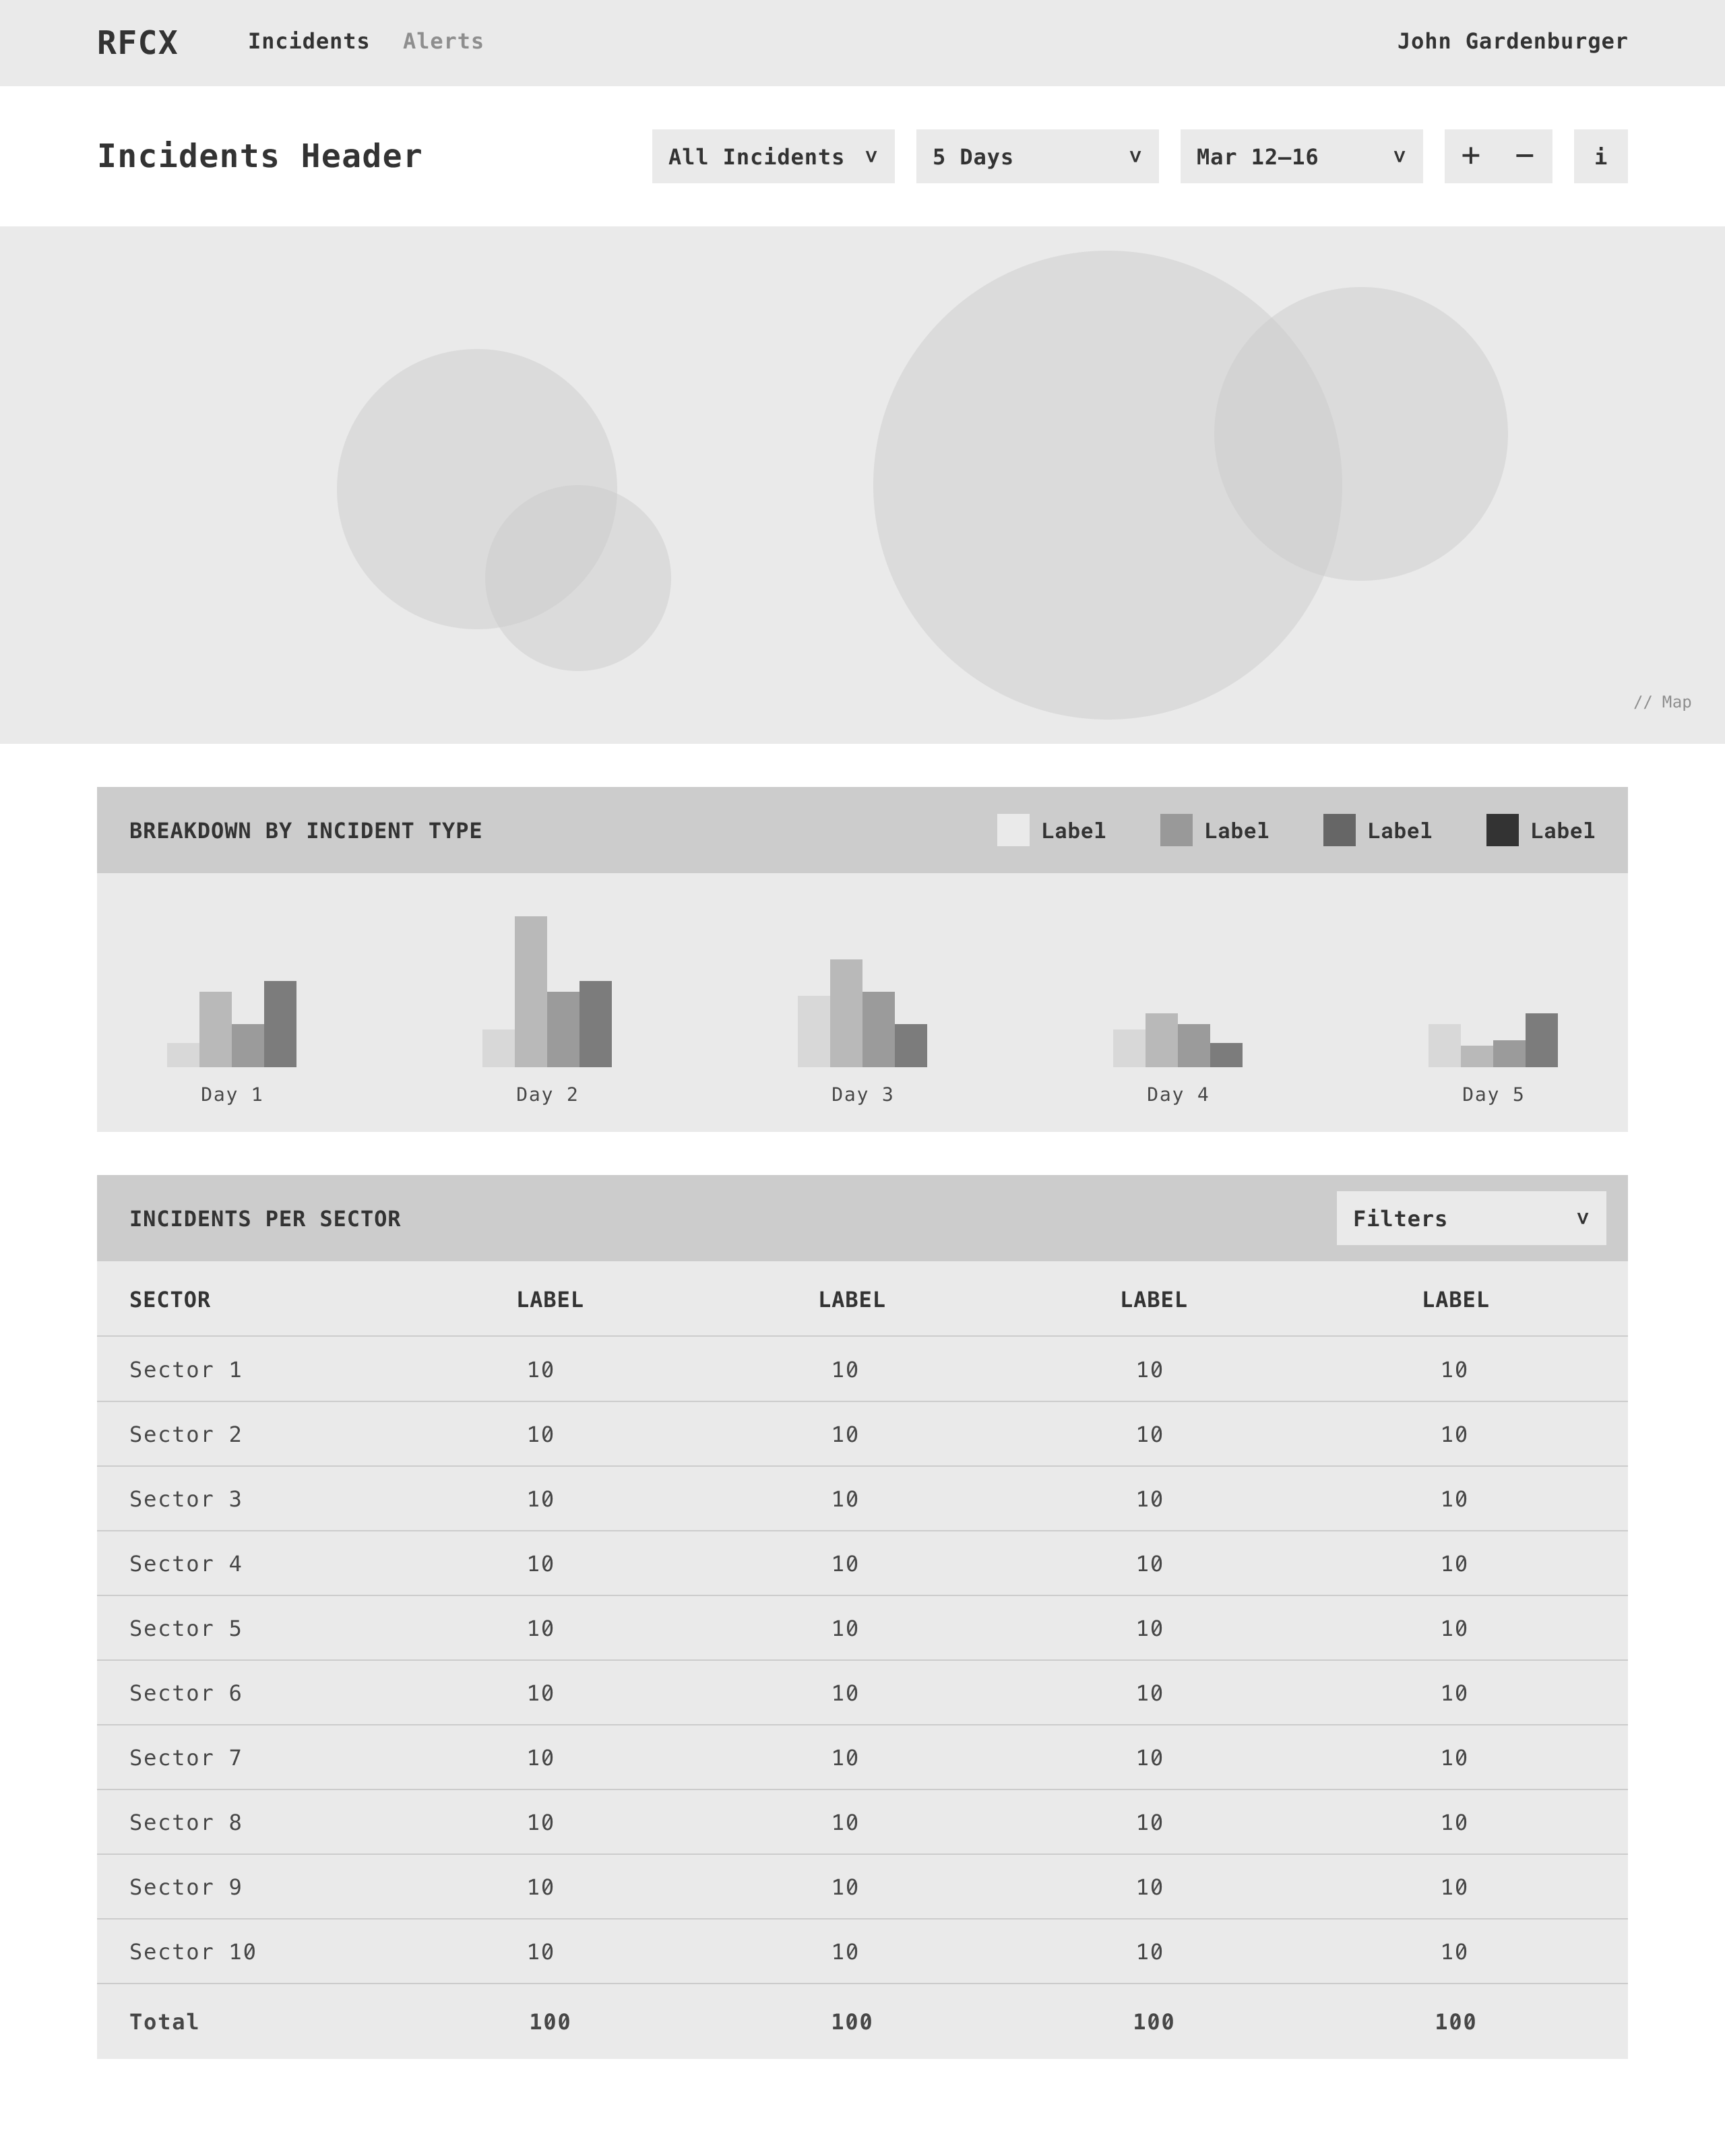
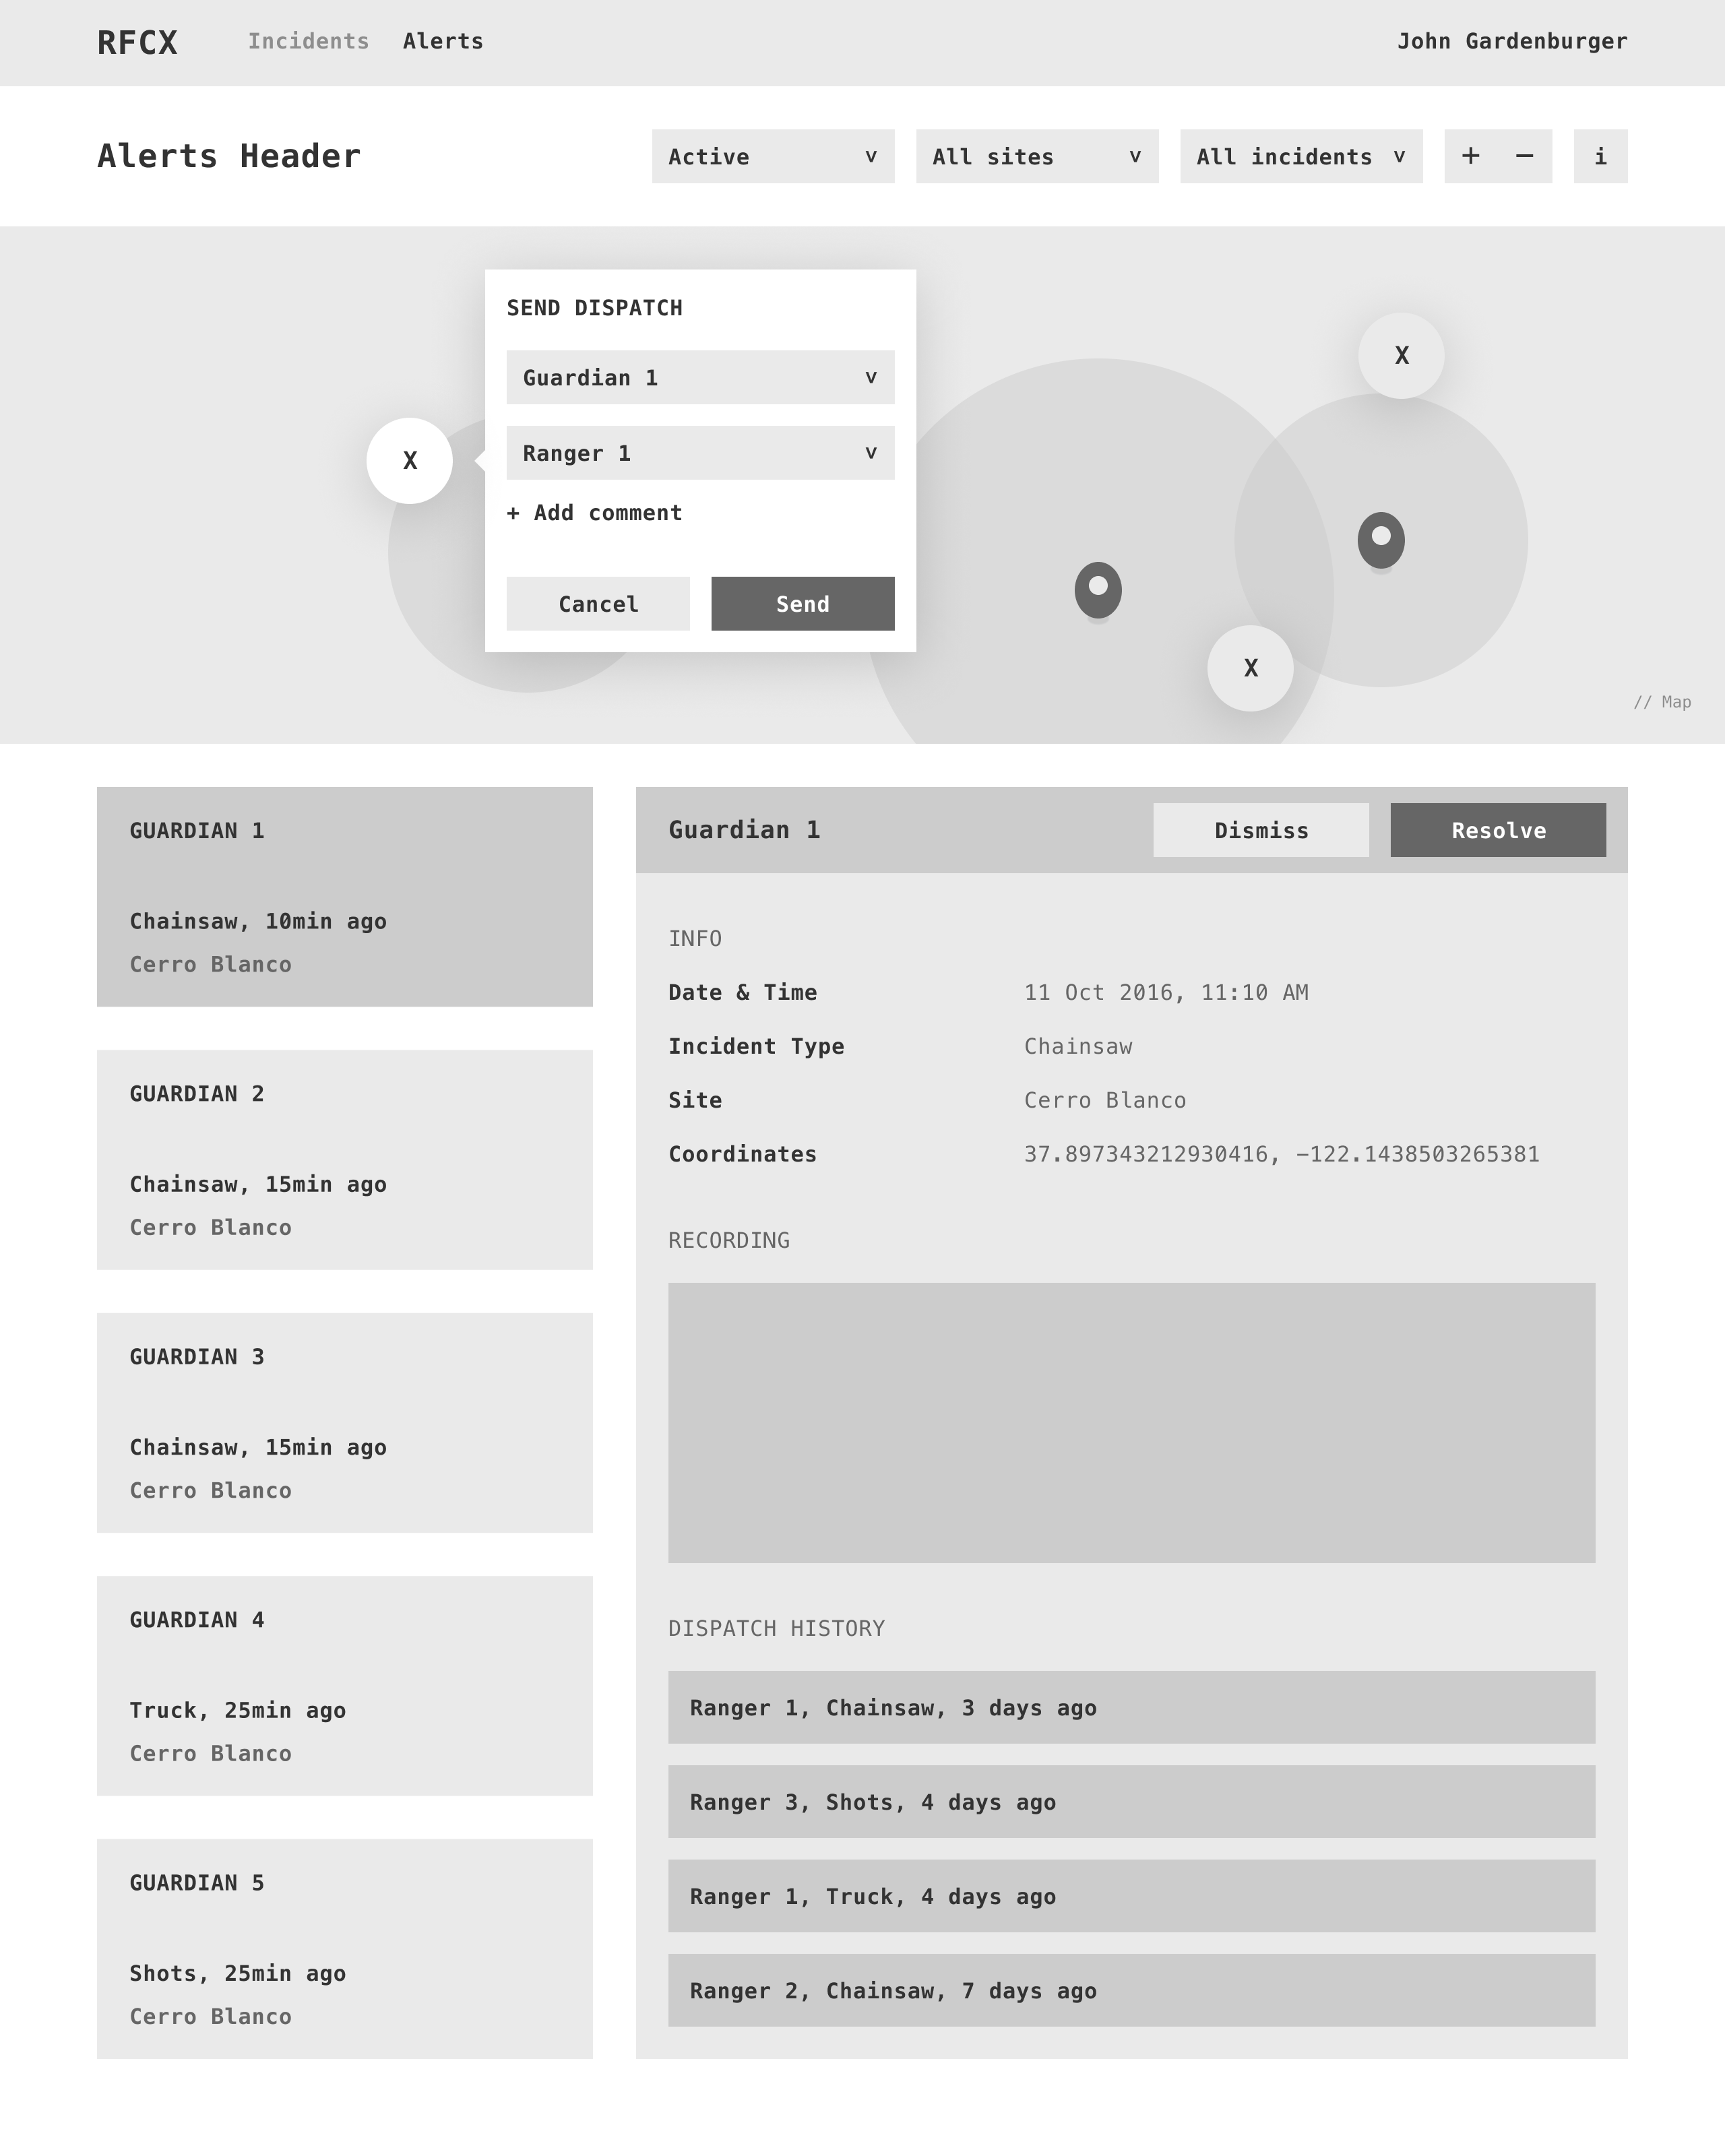
Data Visualization
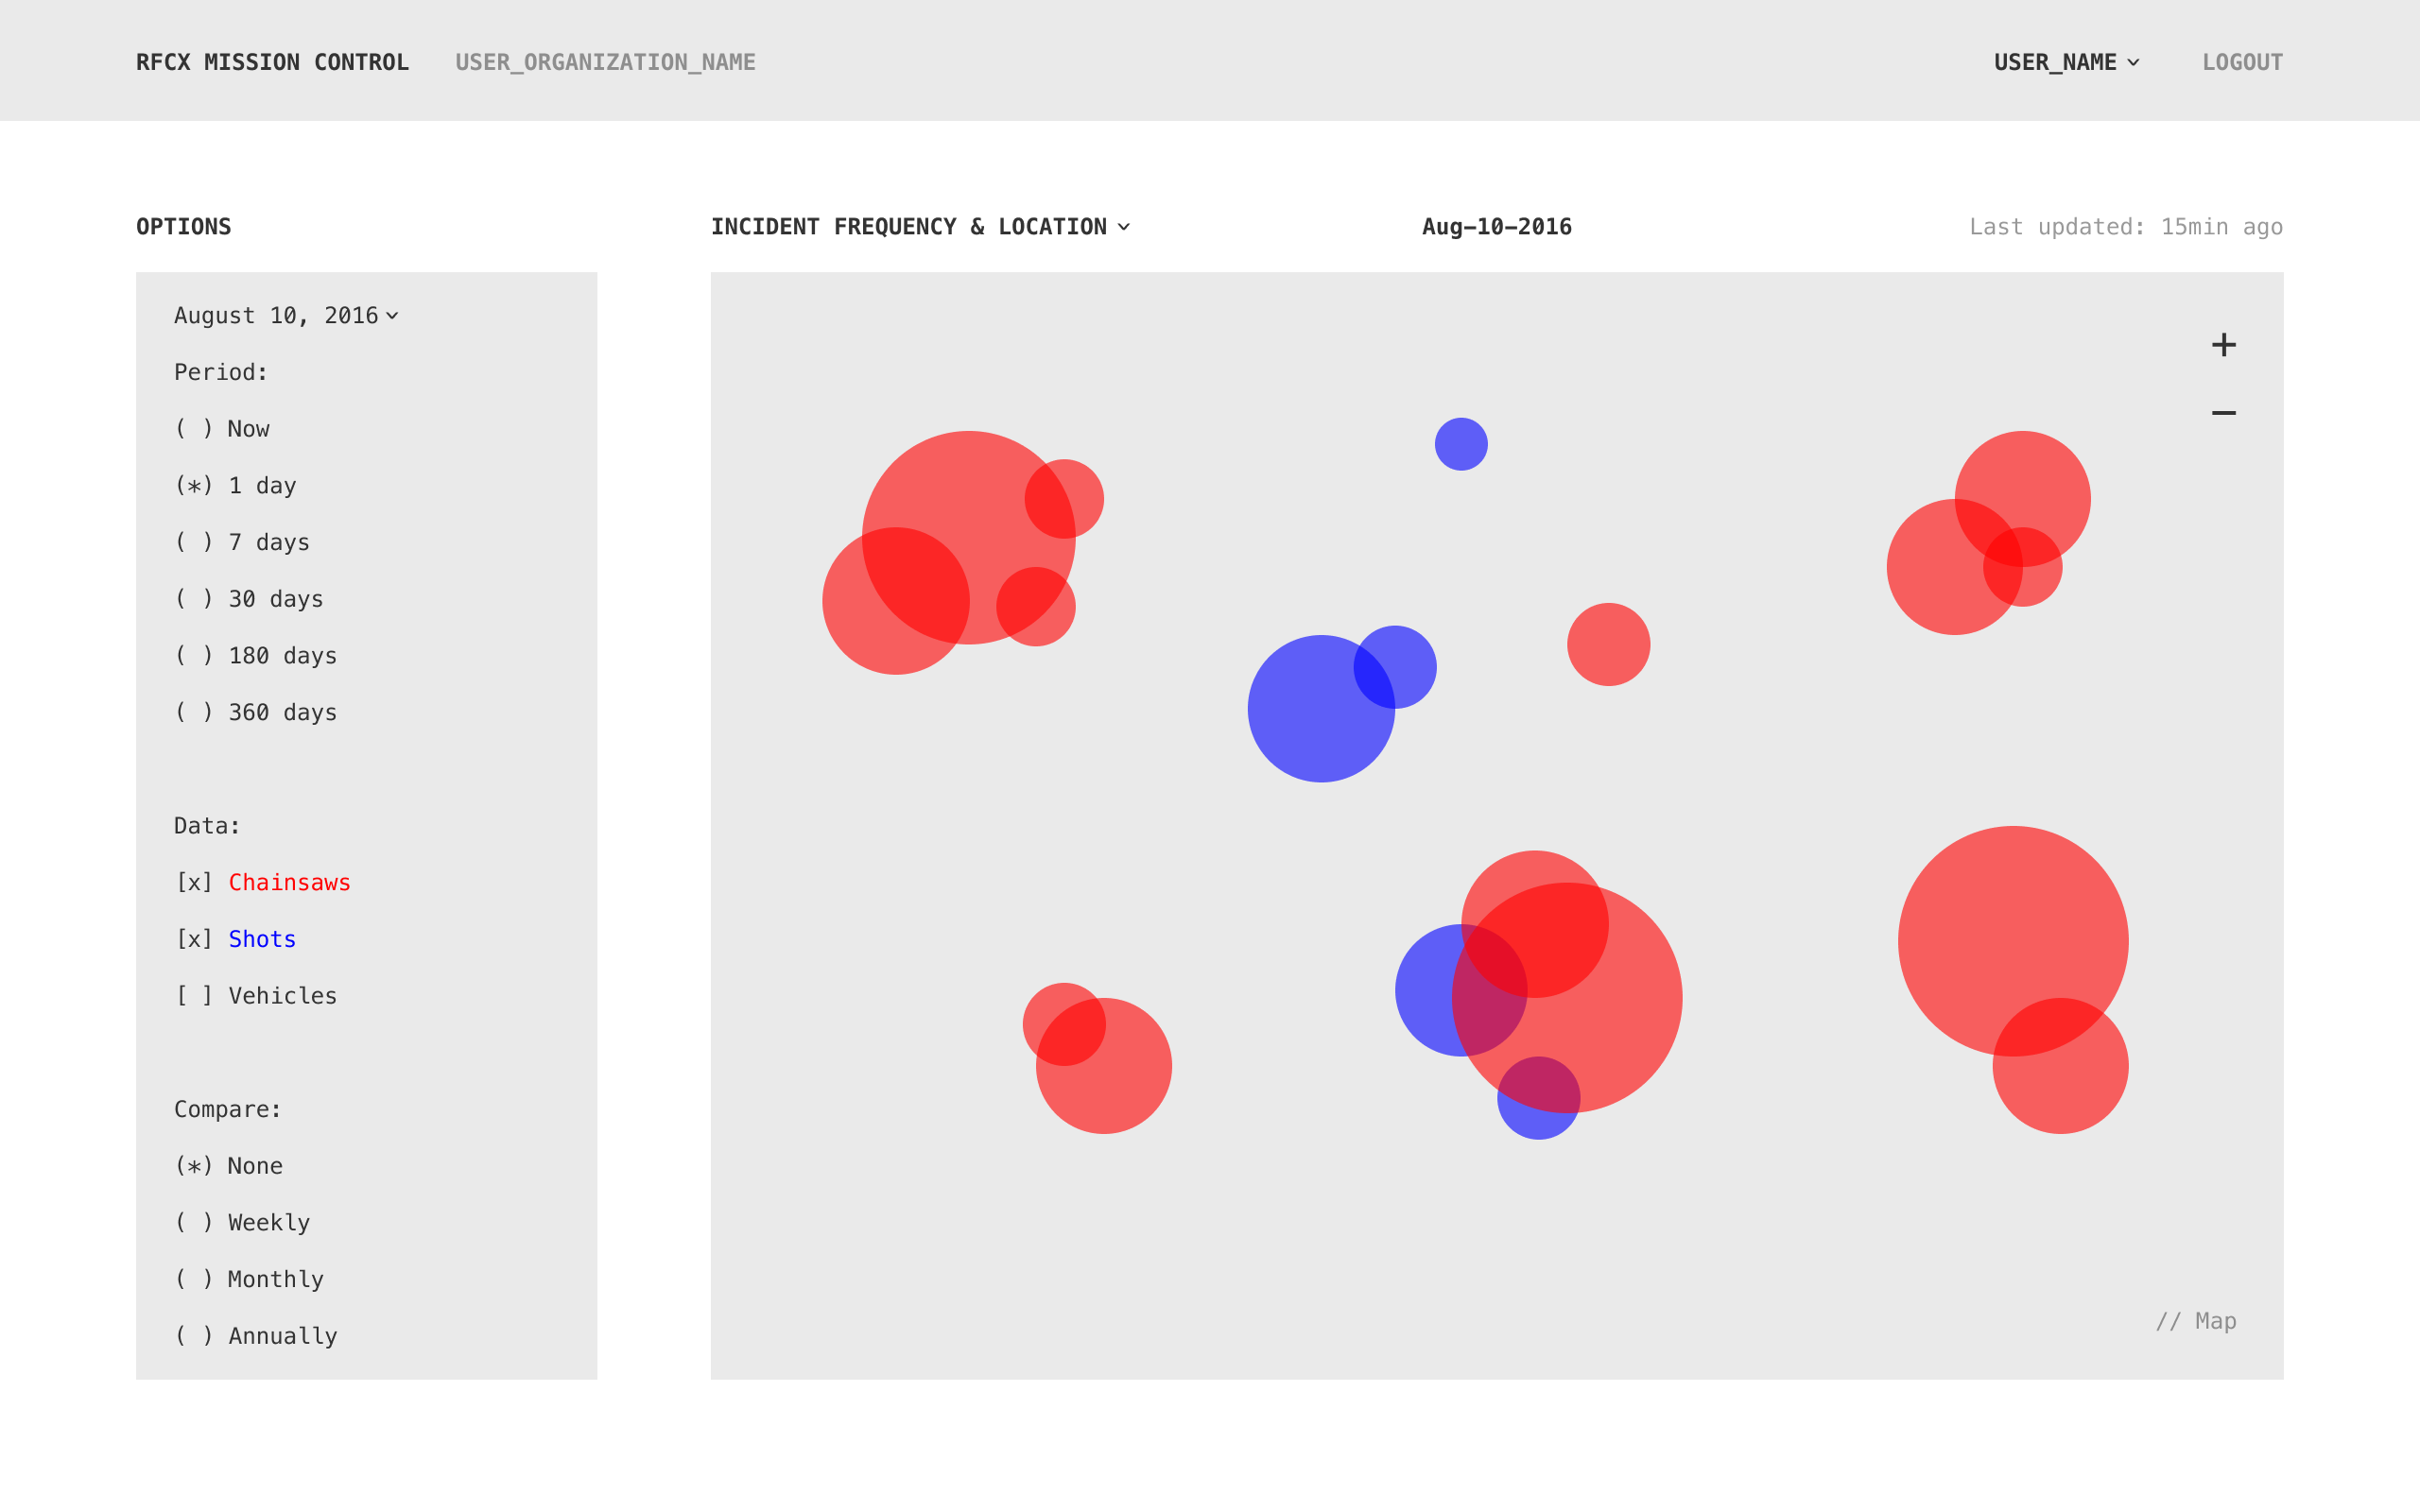
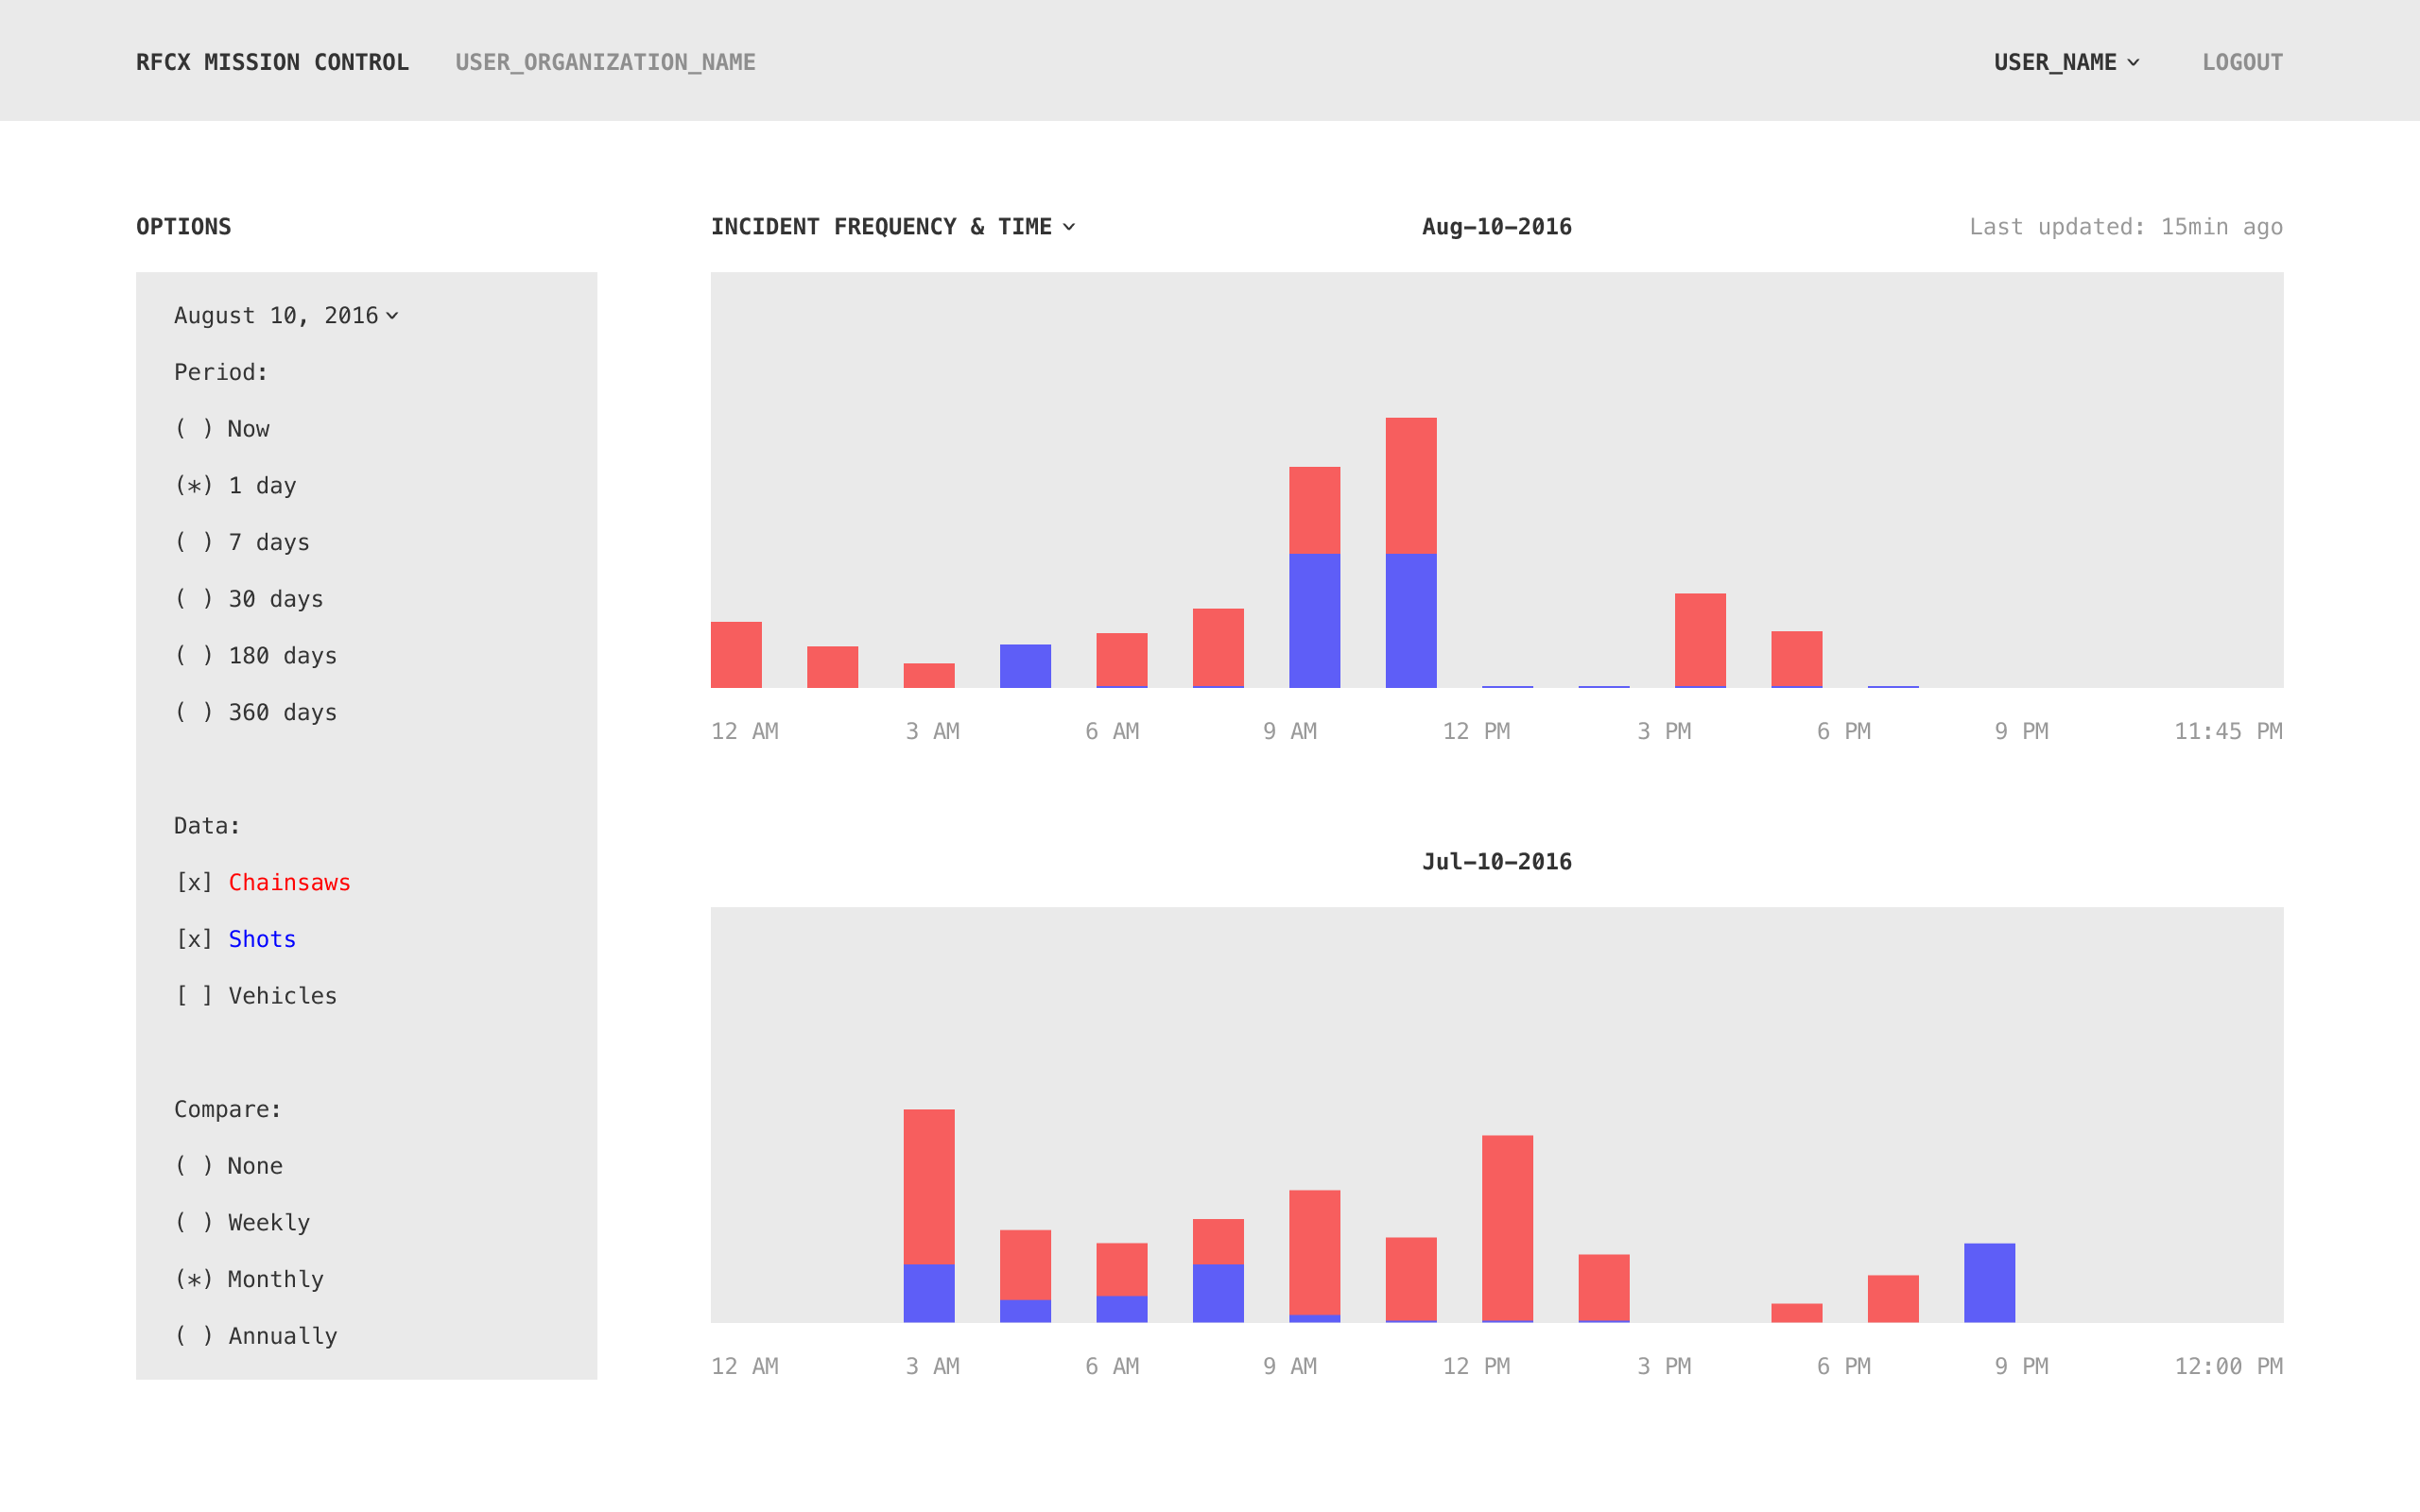
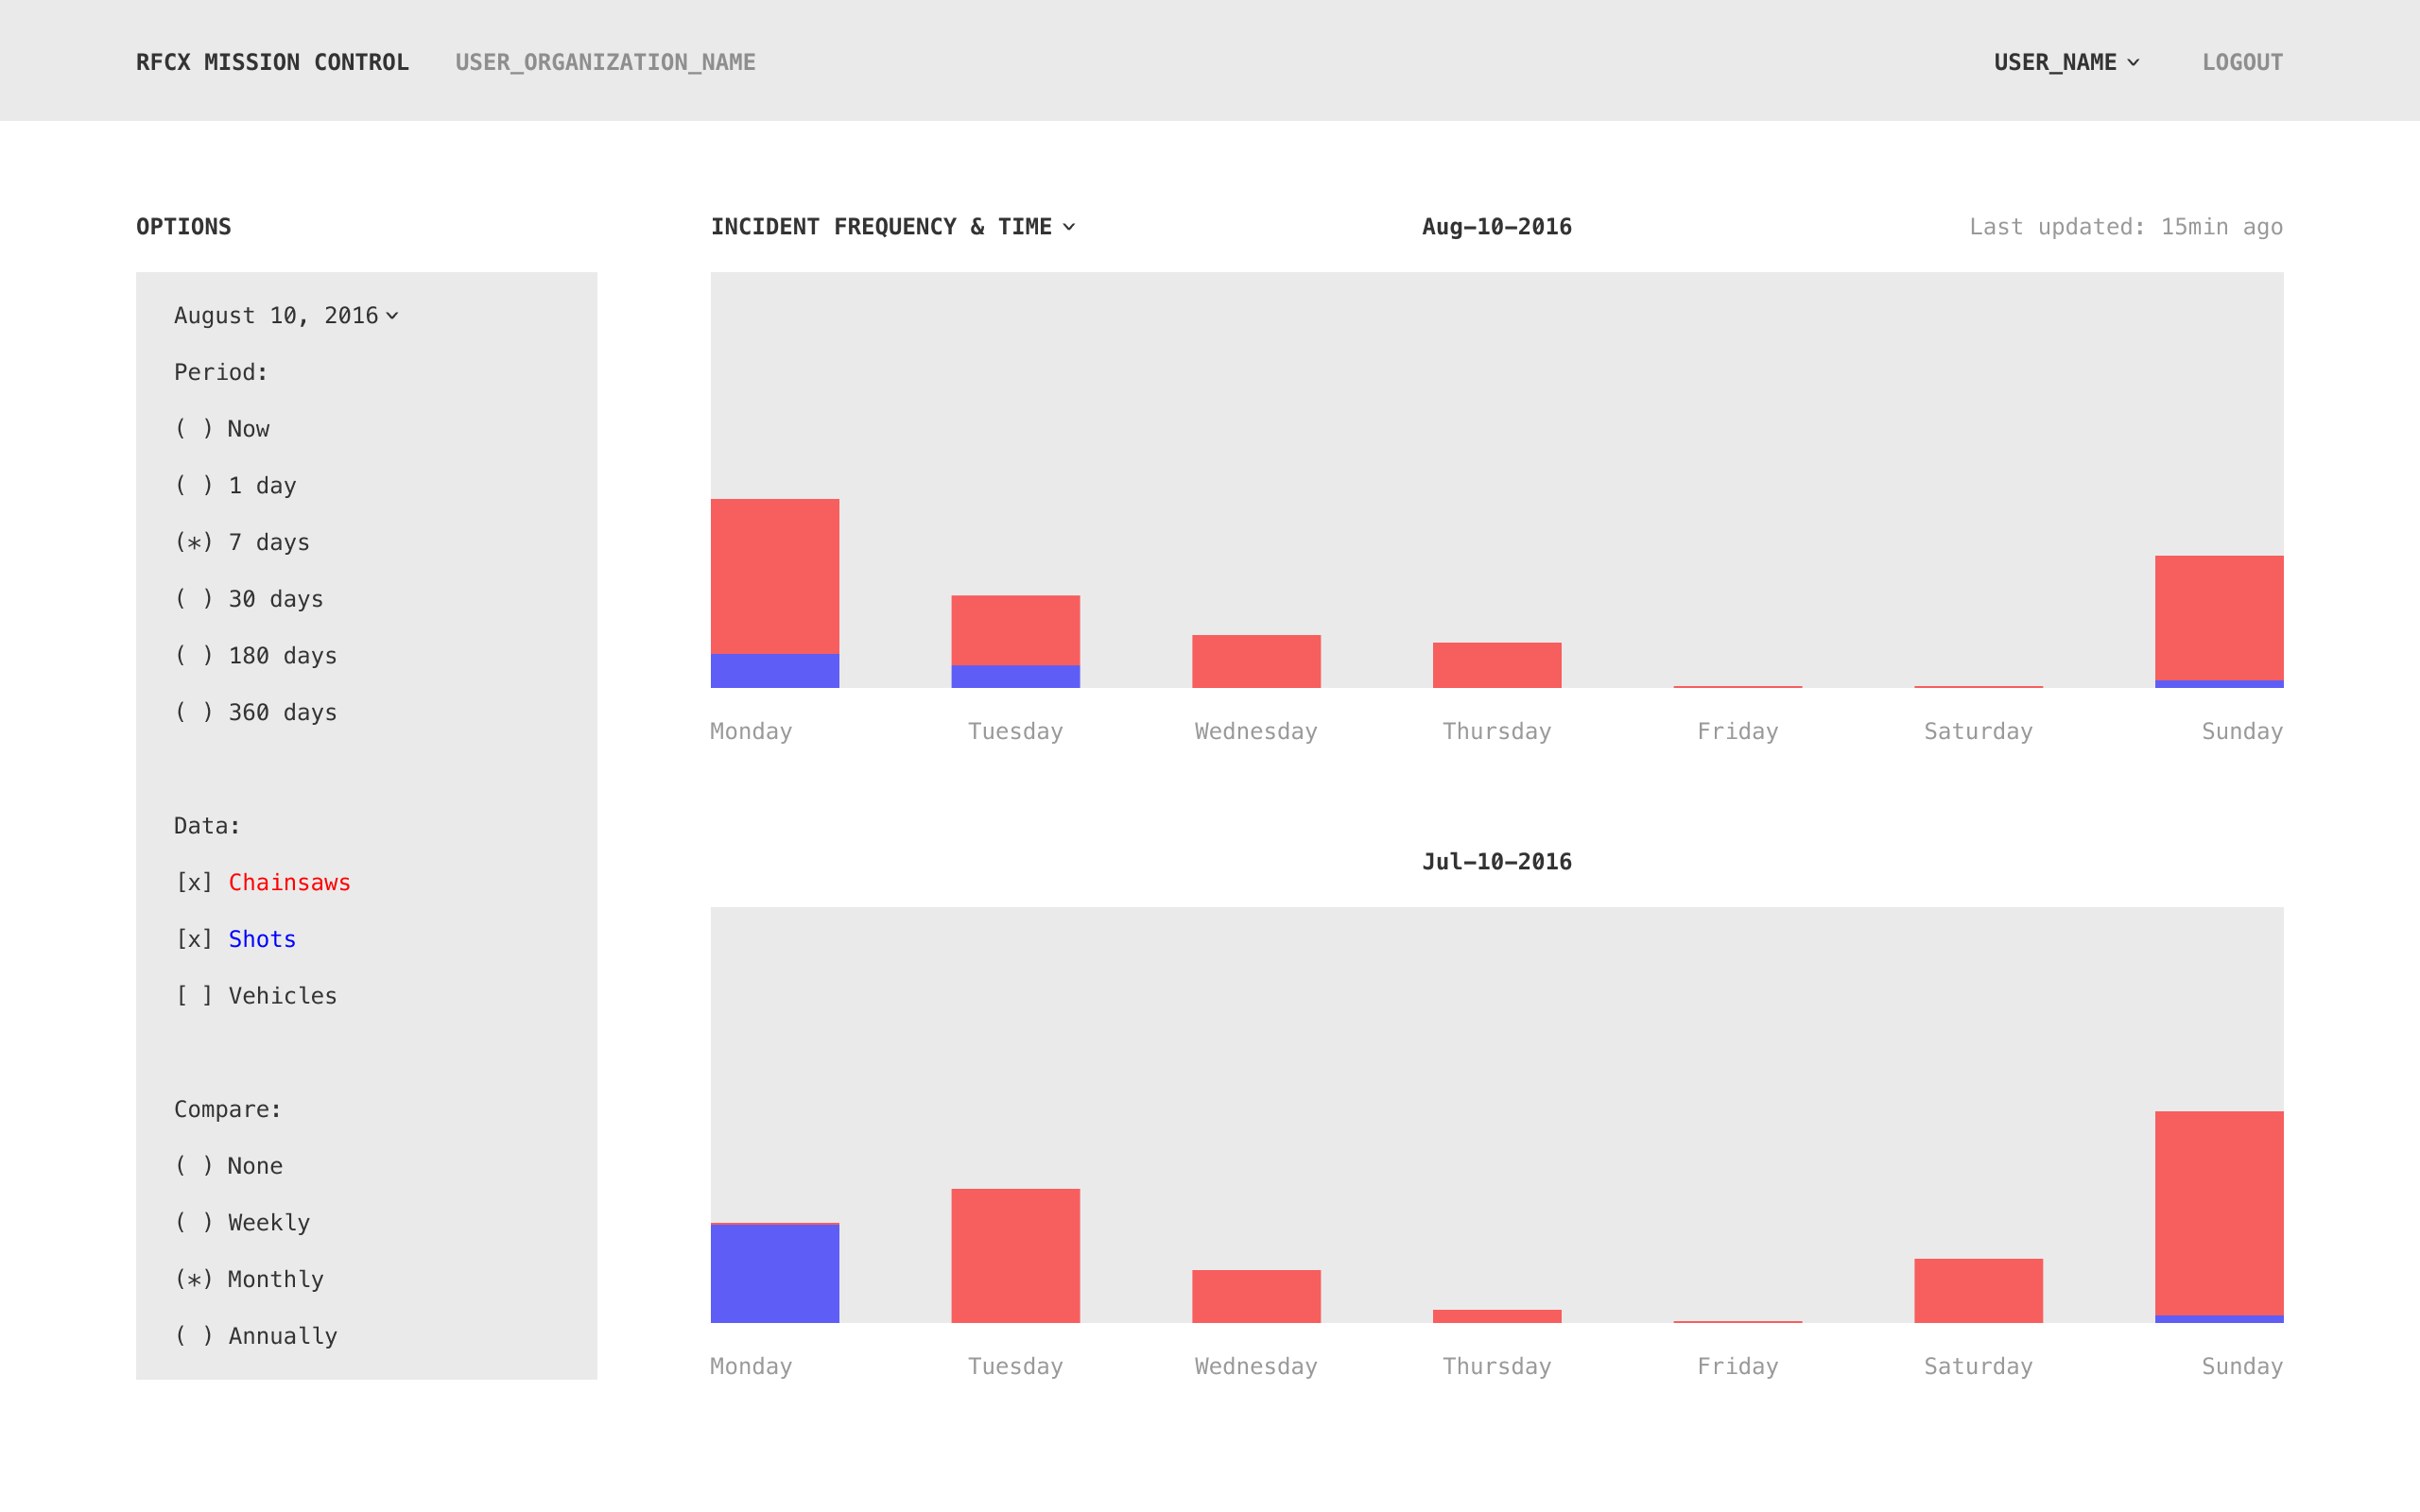
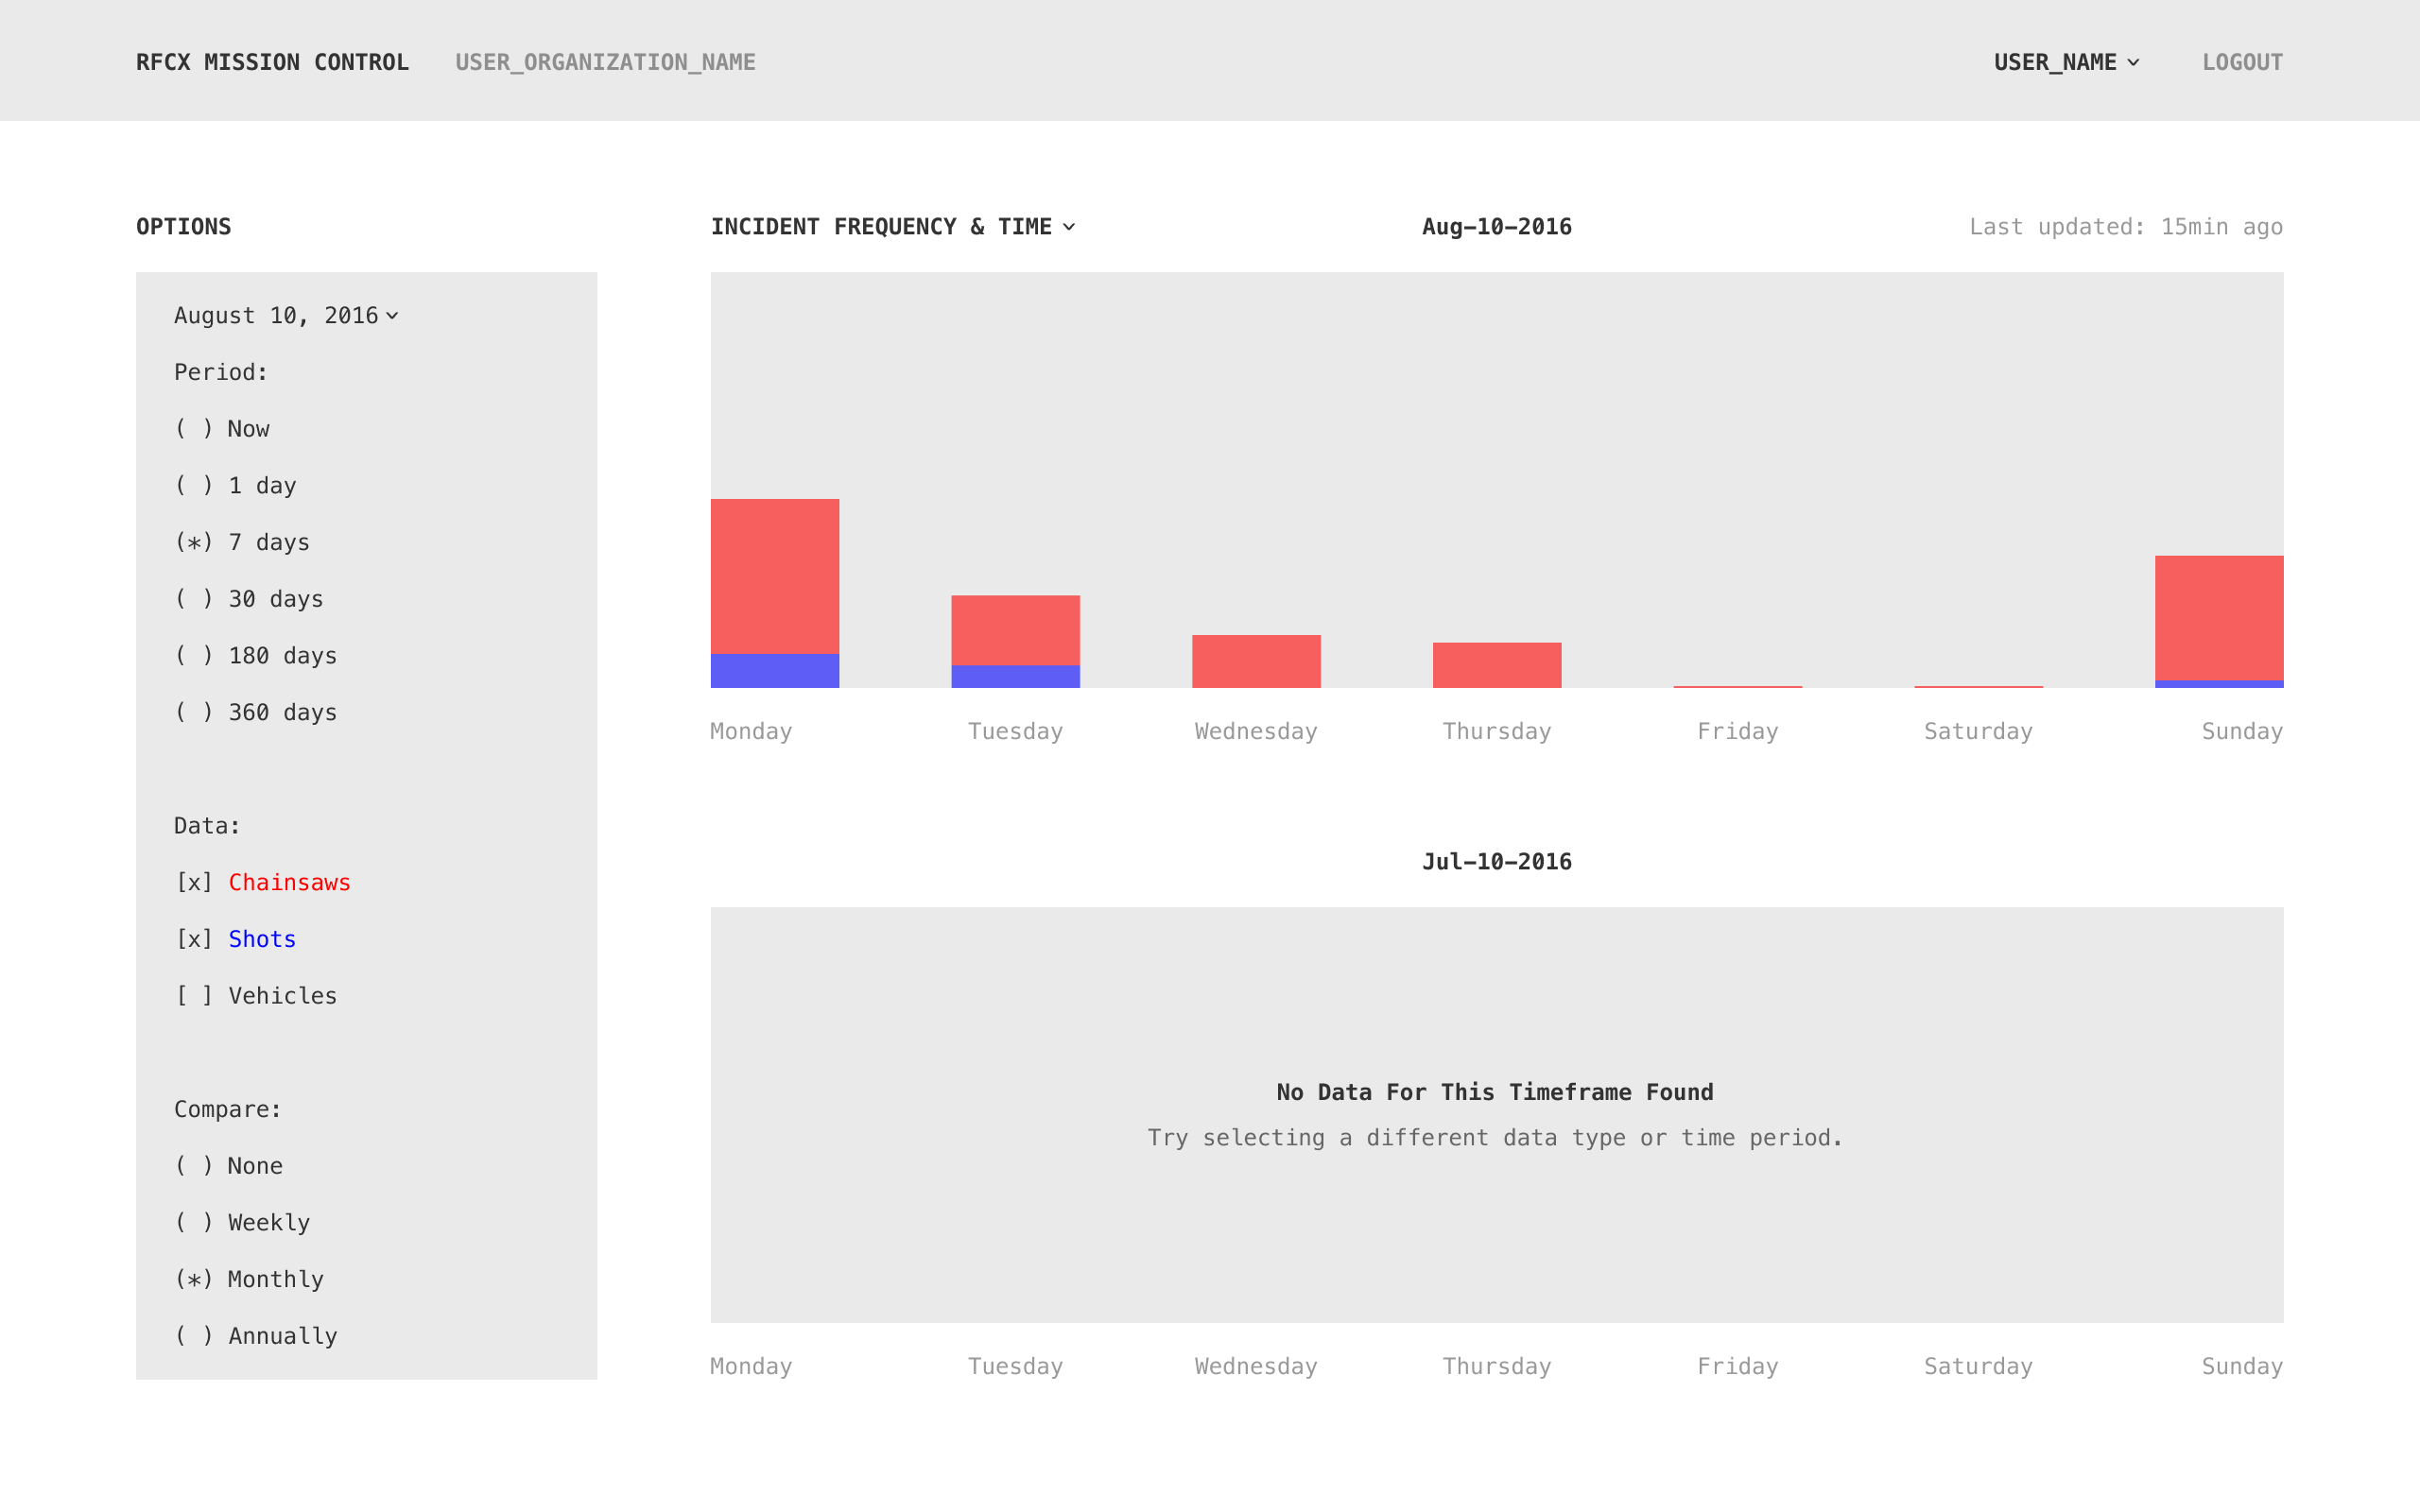
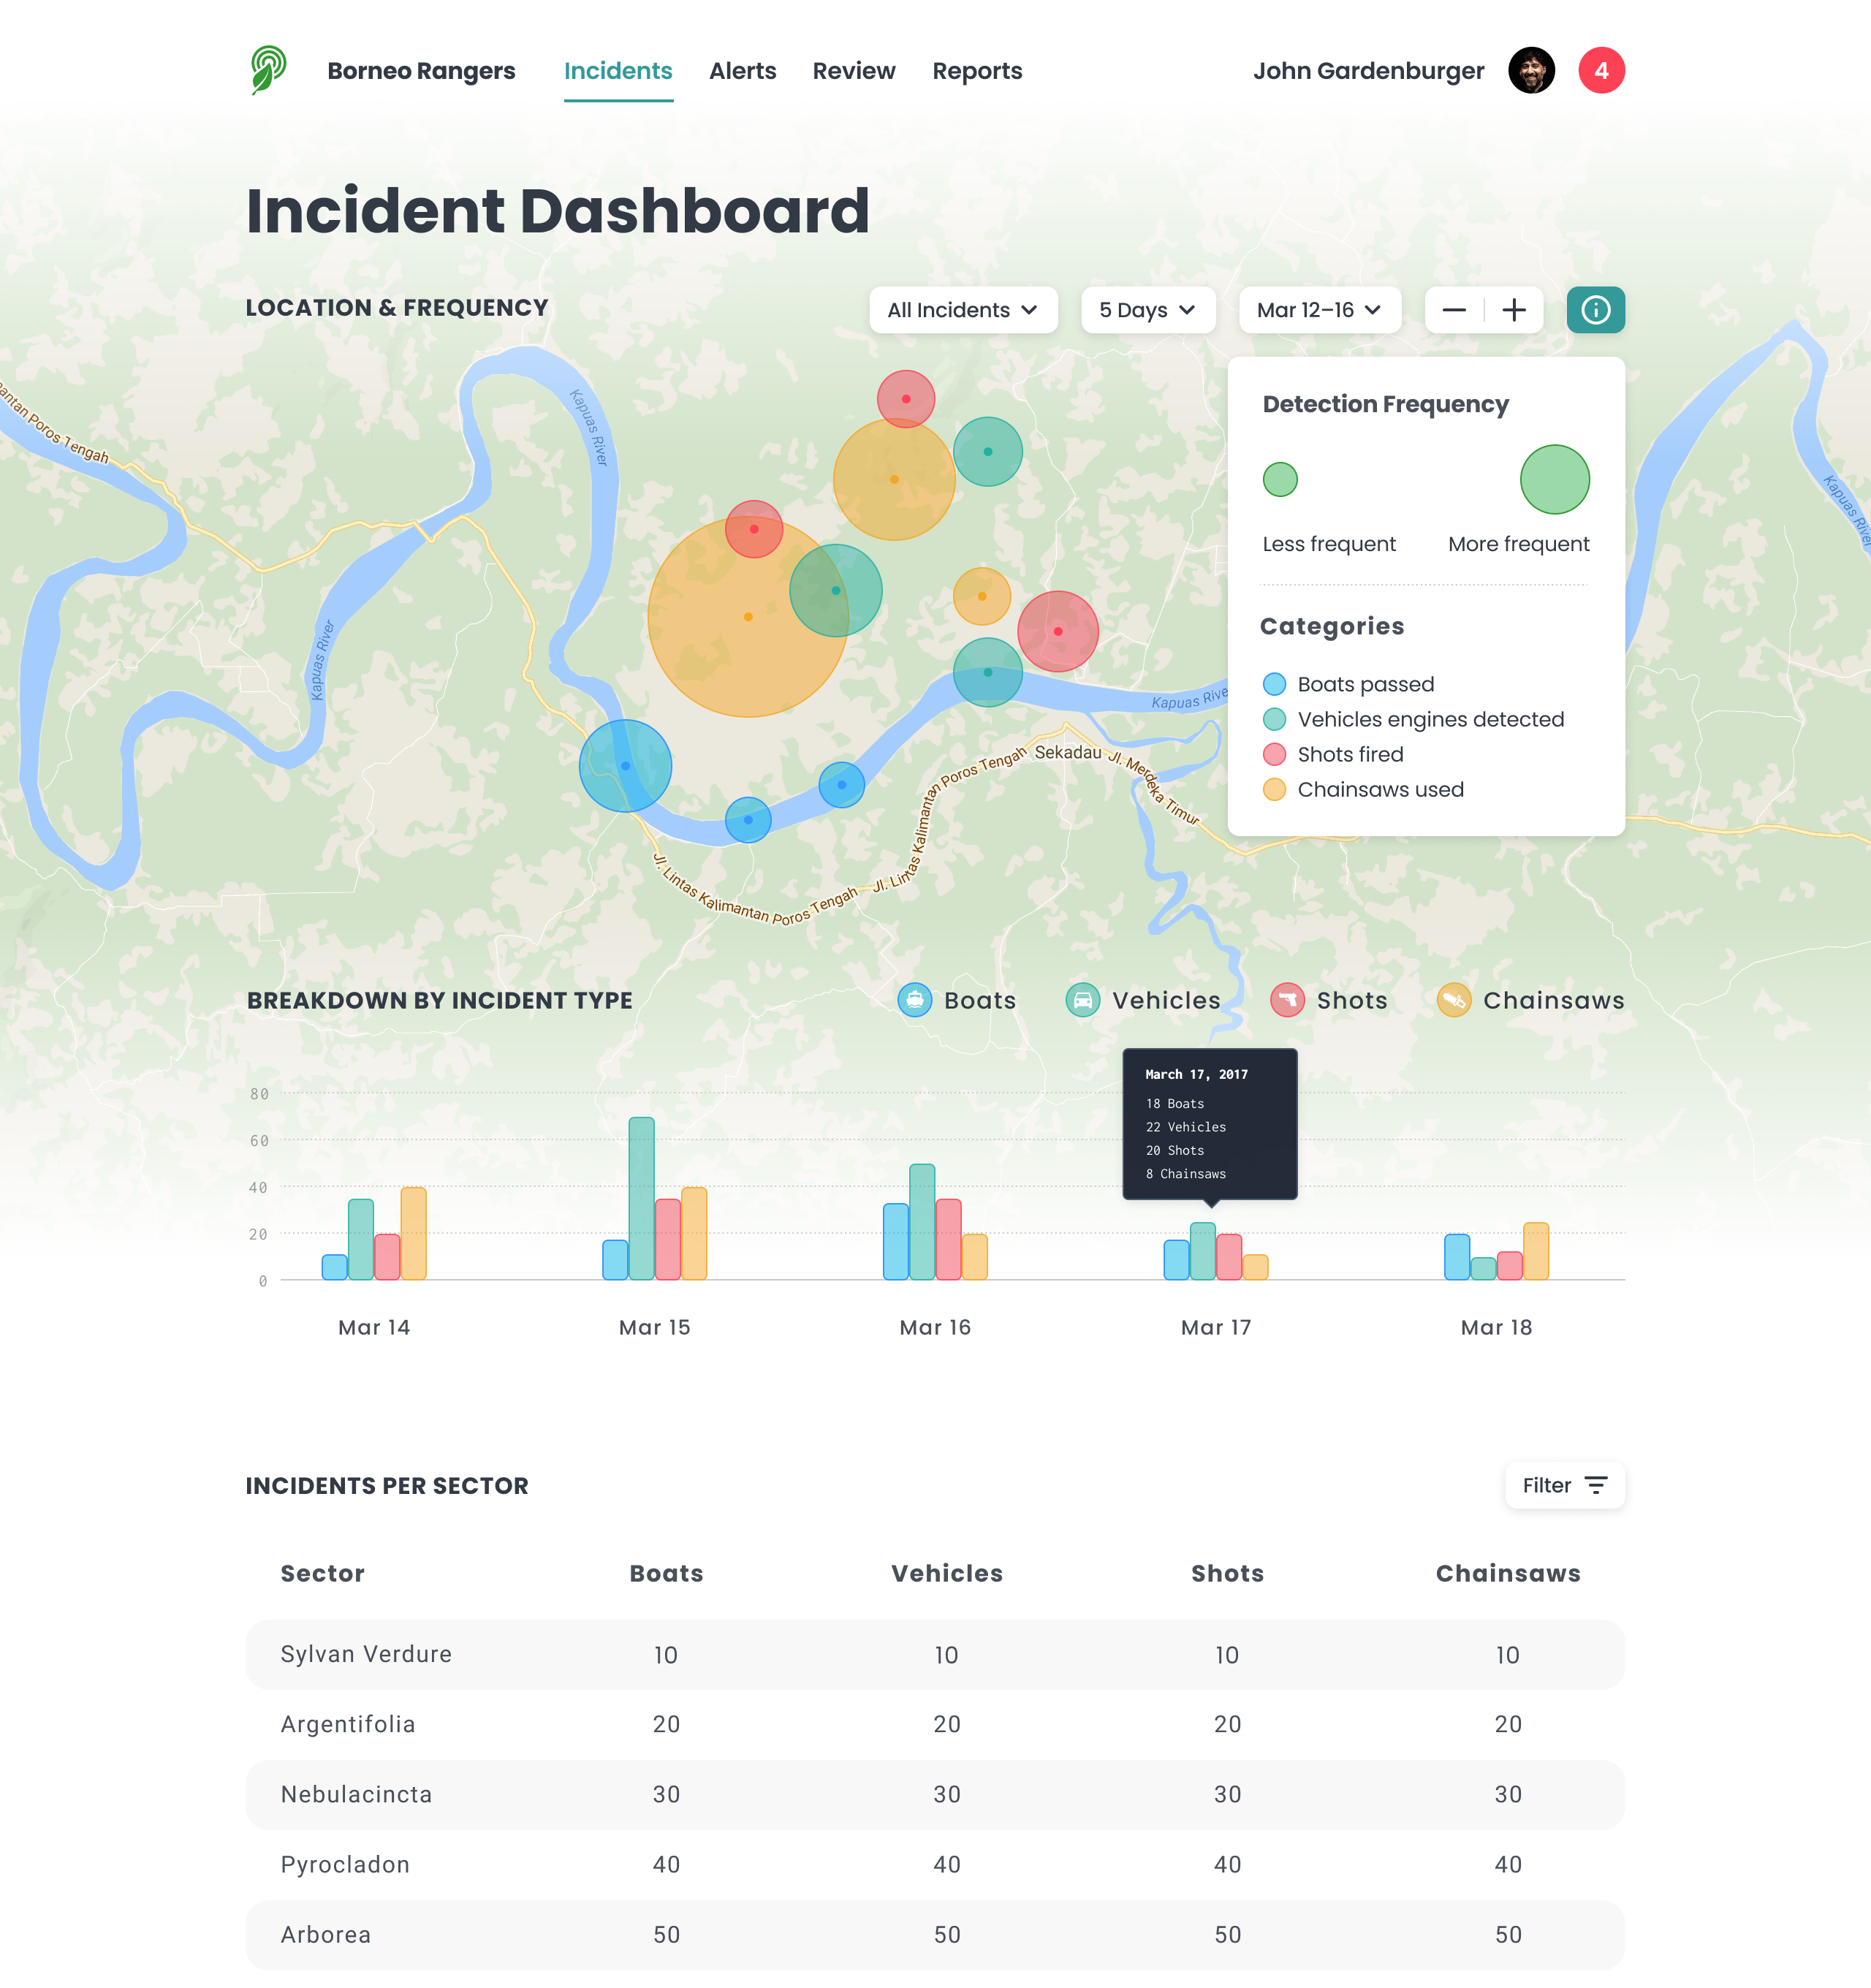
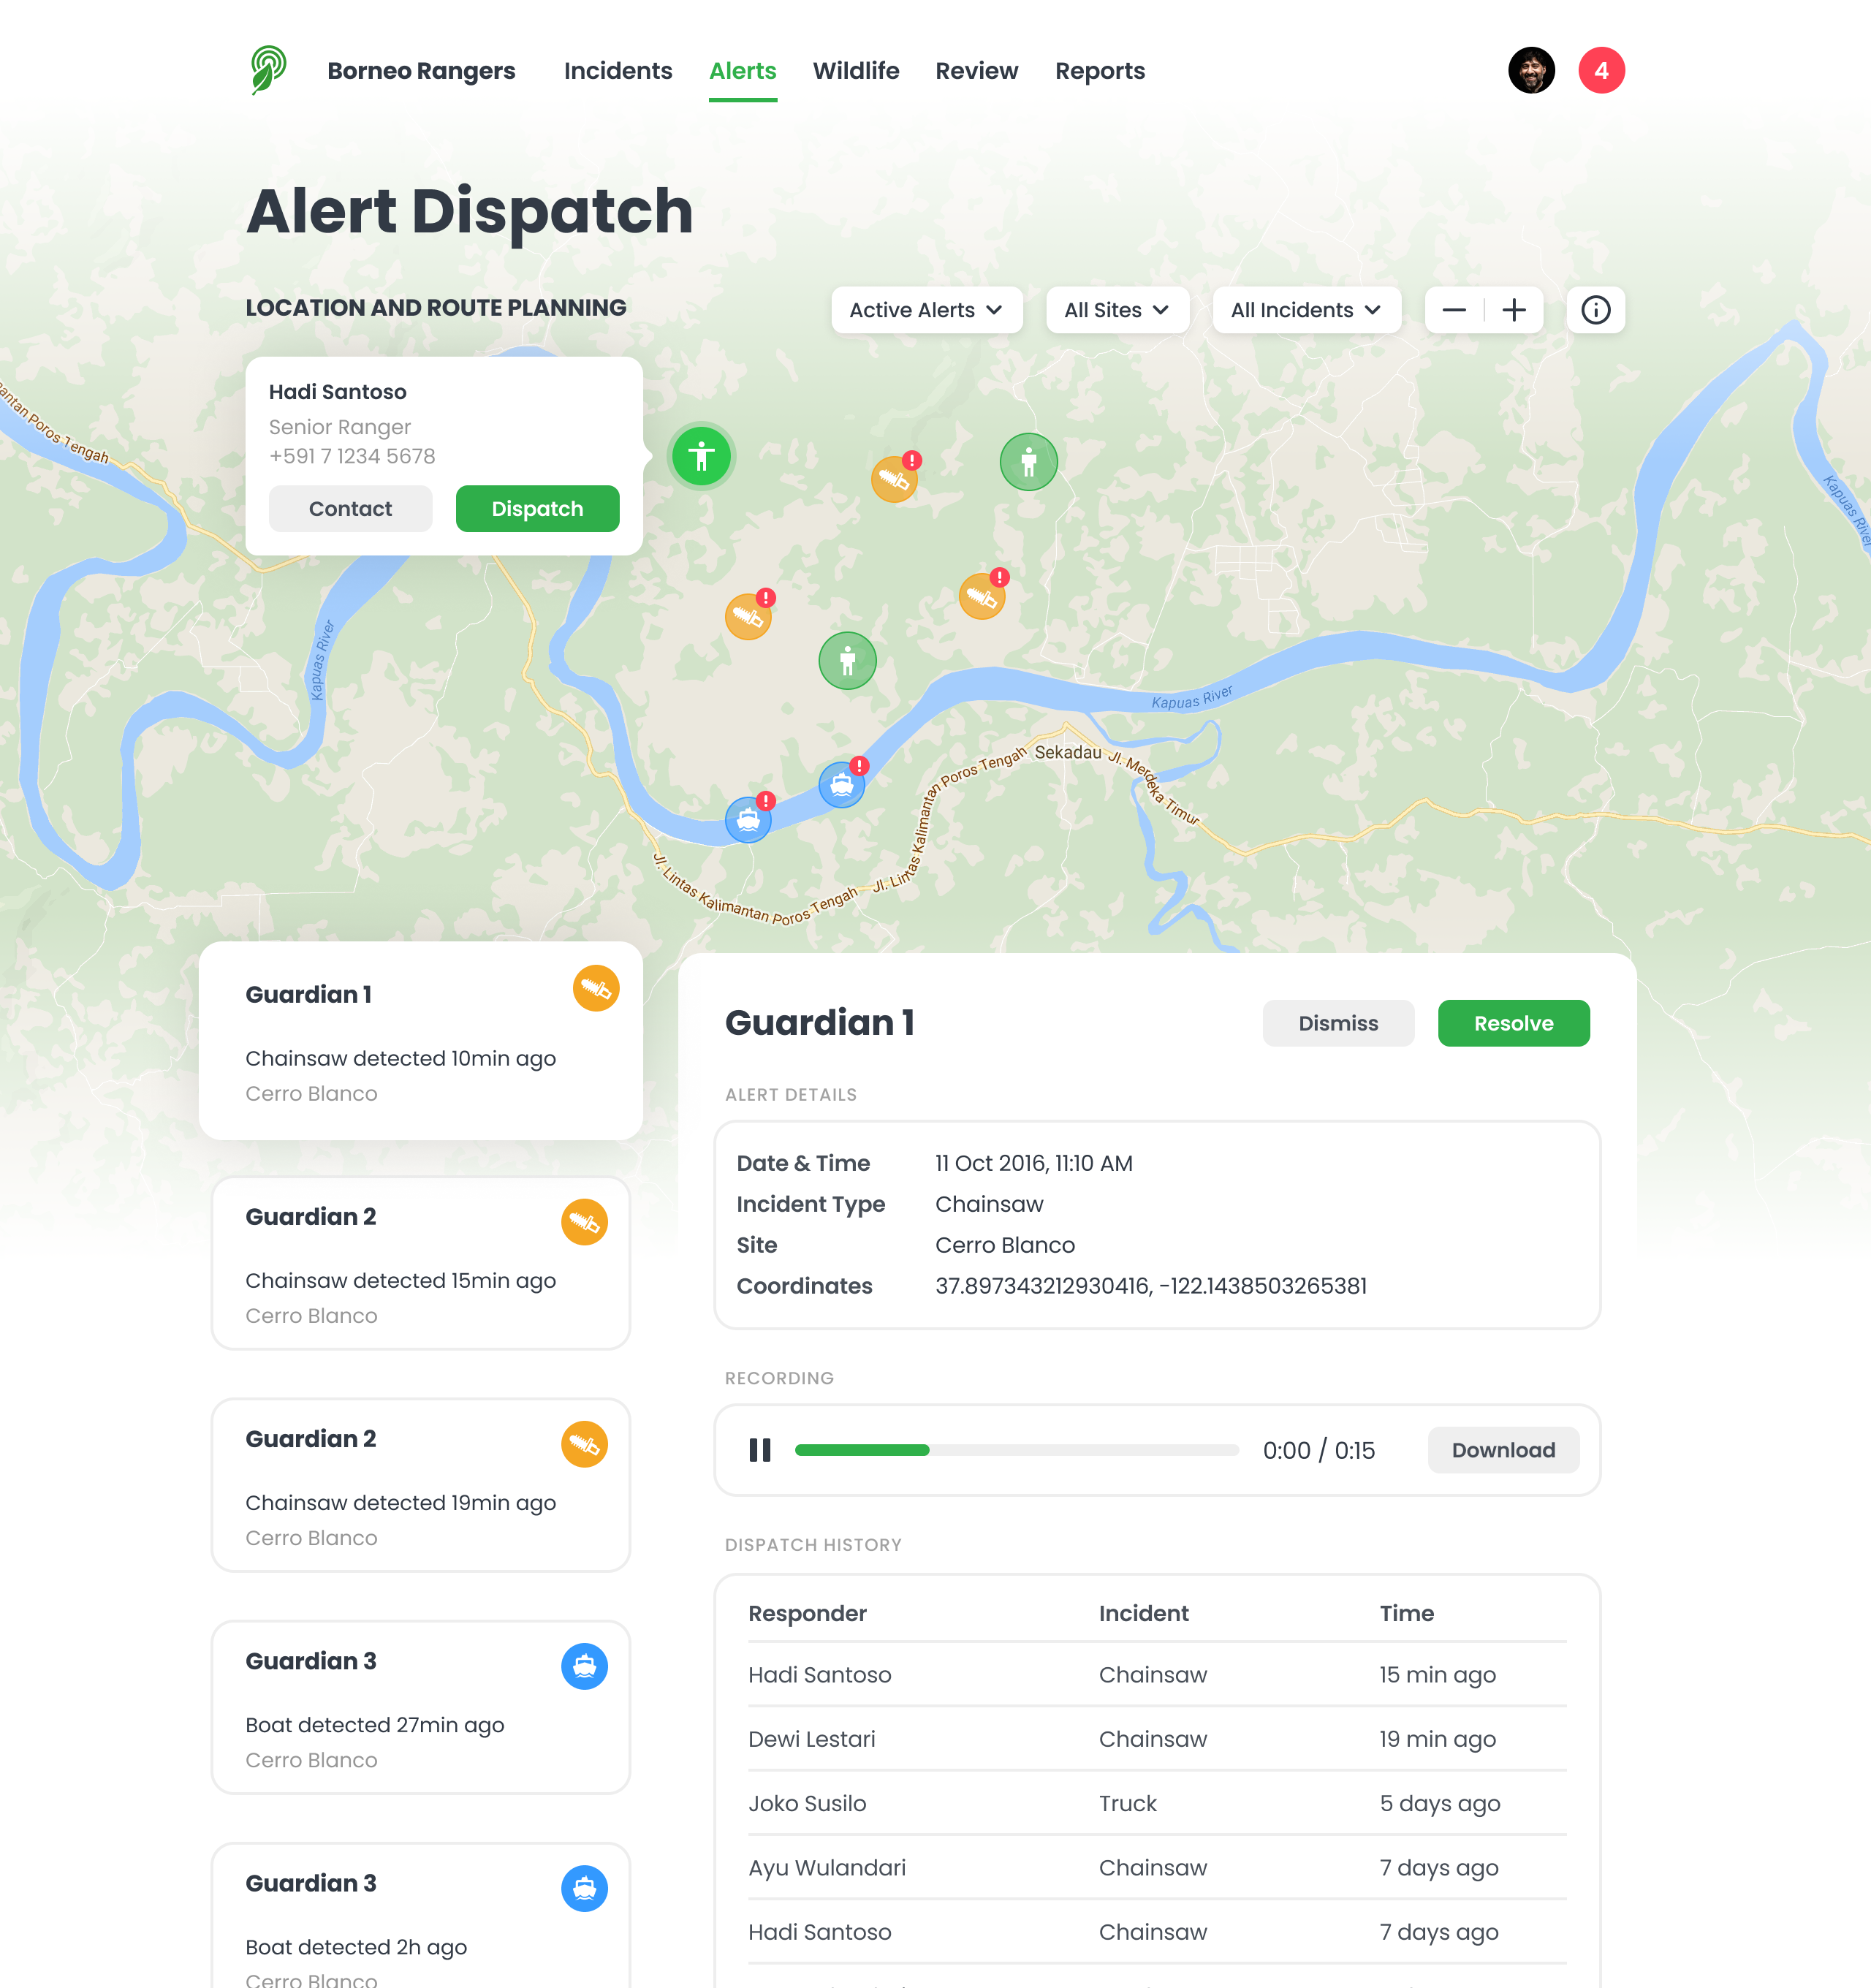
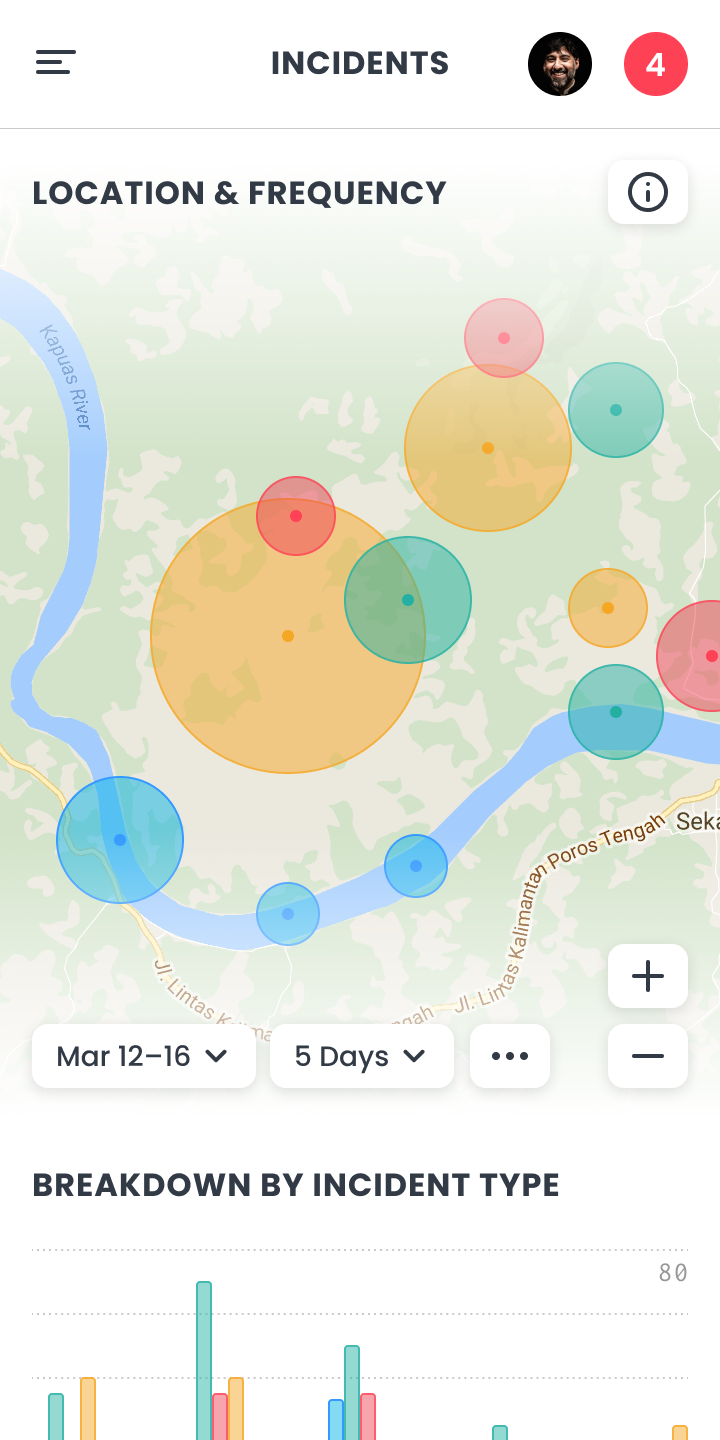
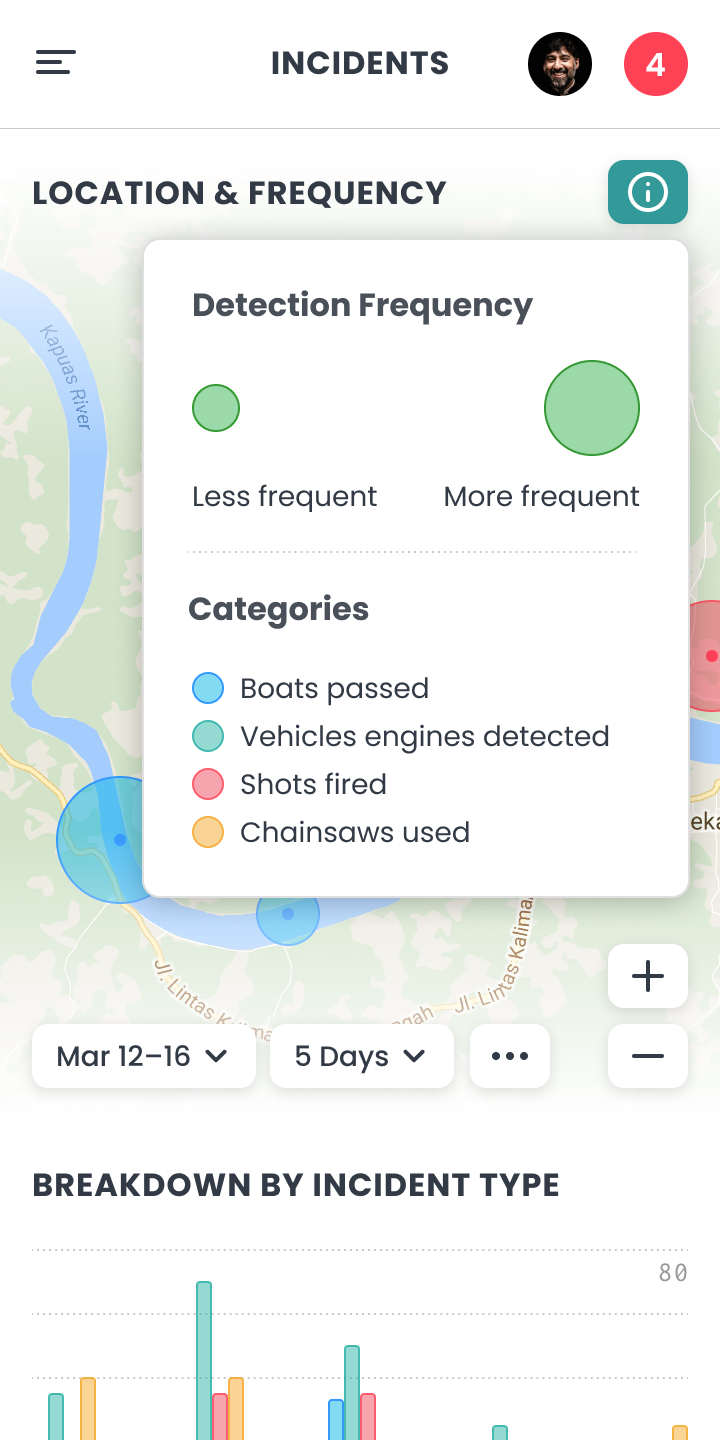
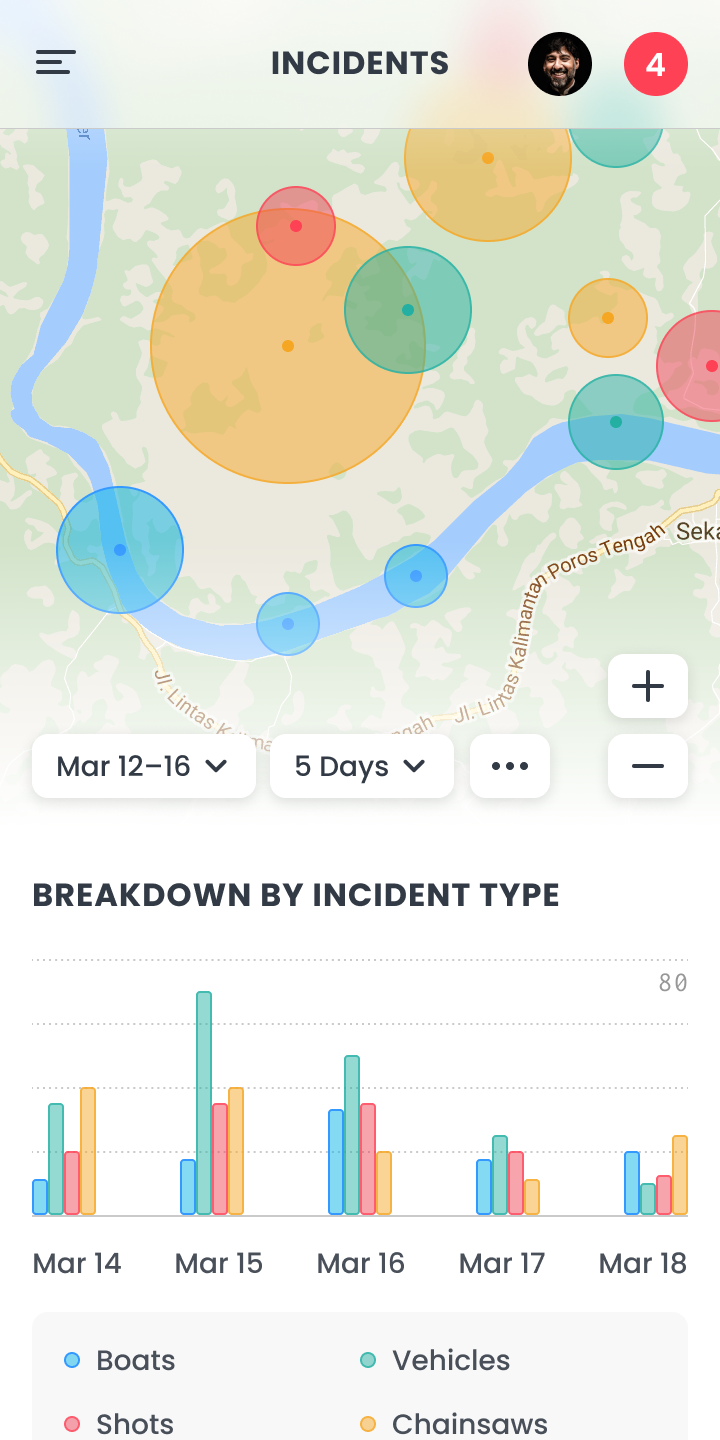
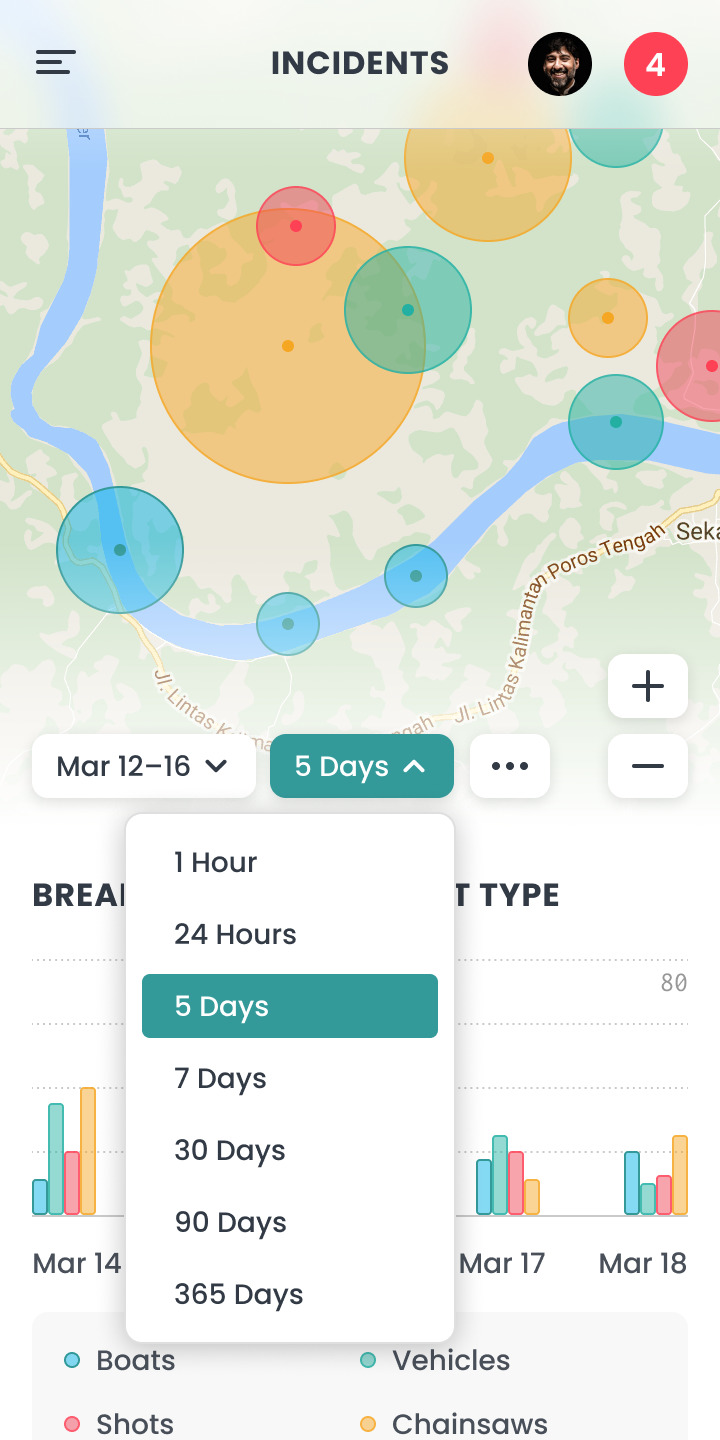
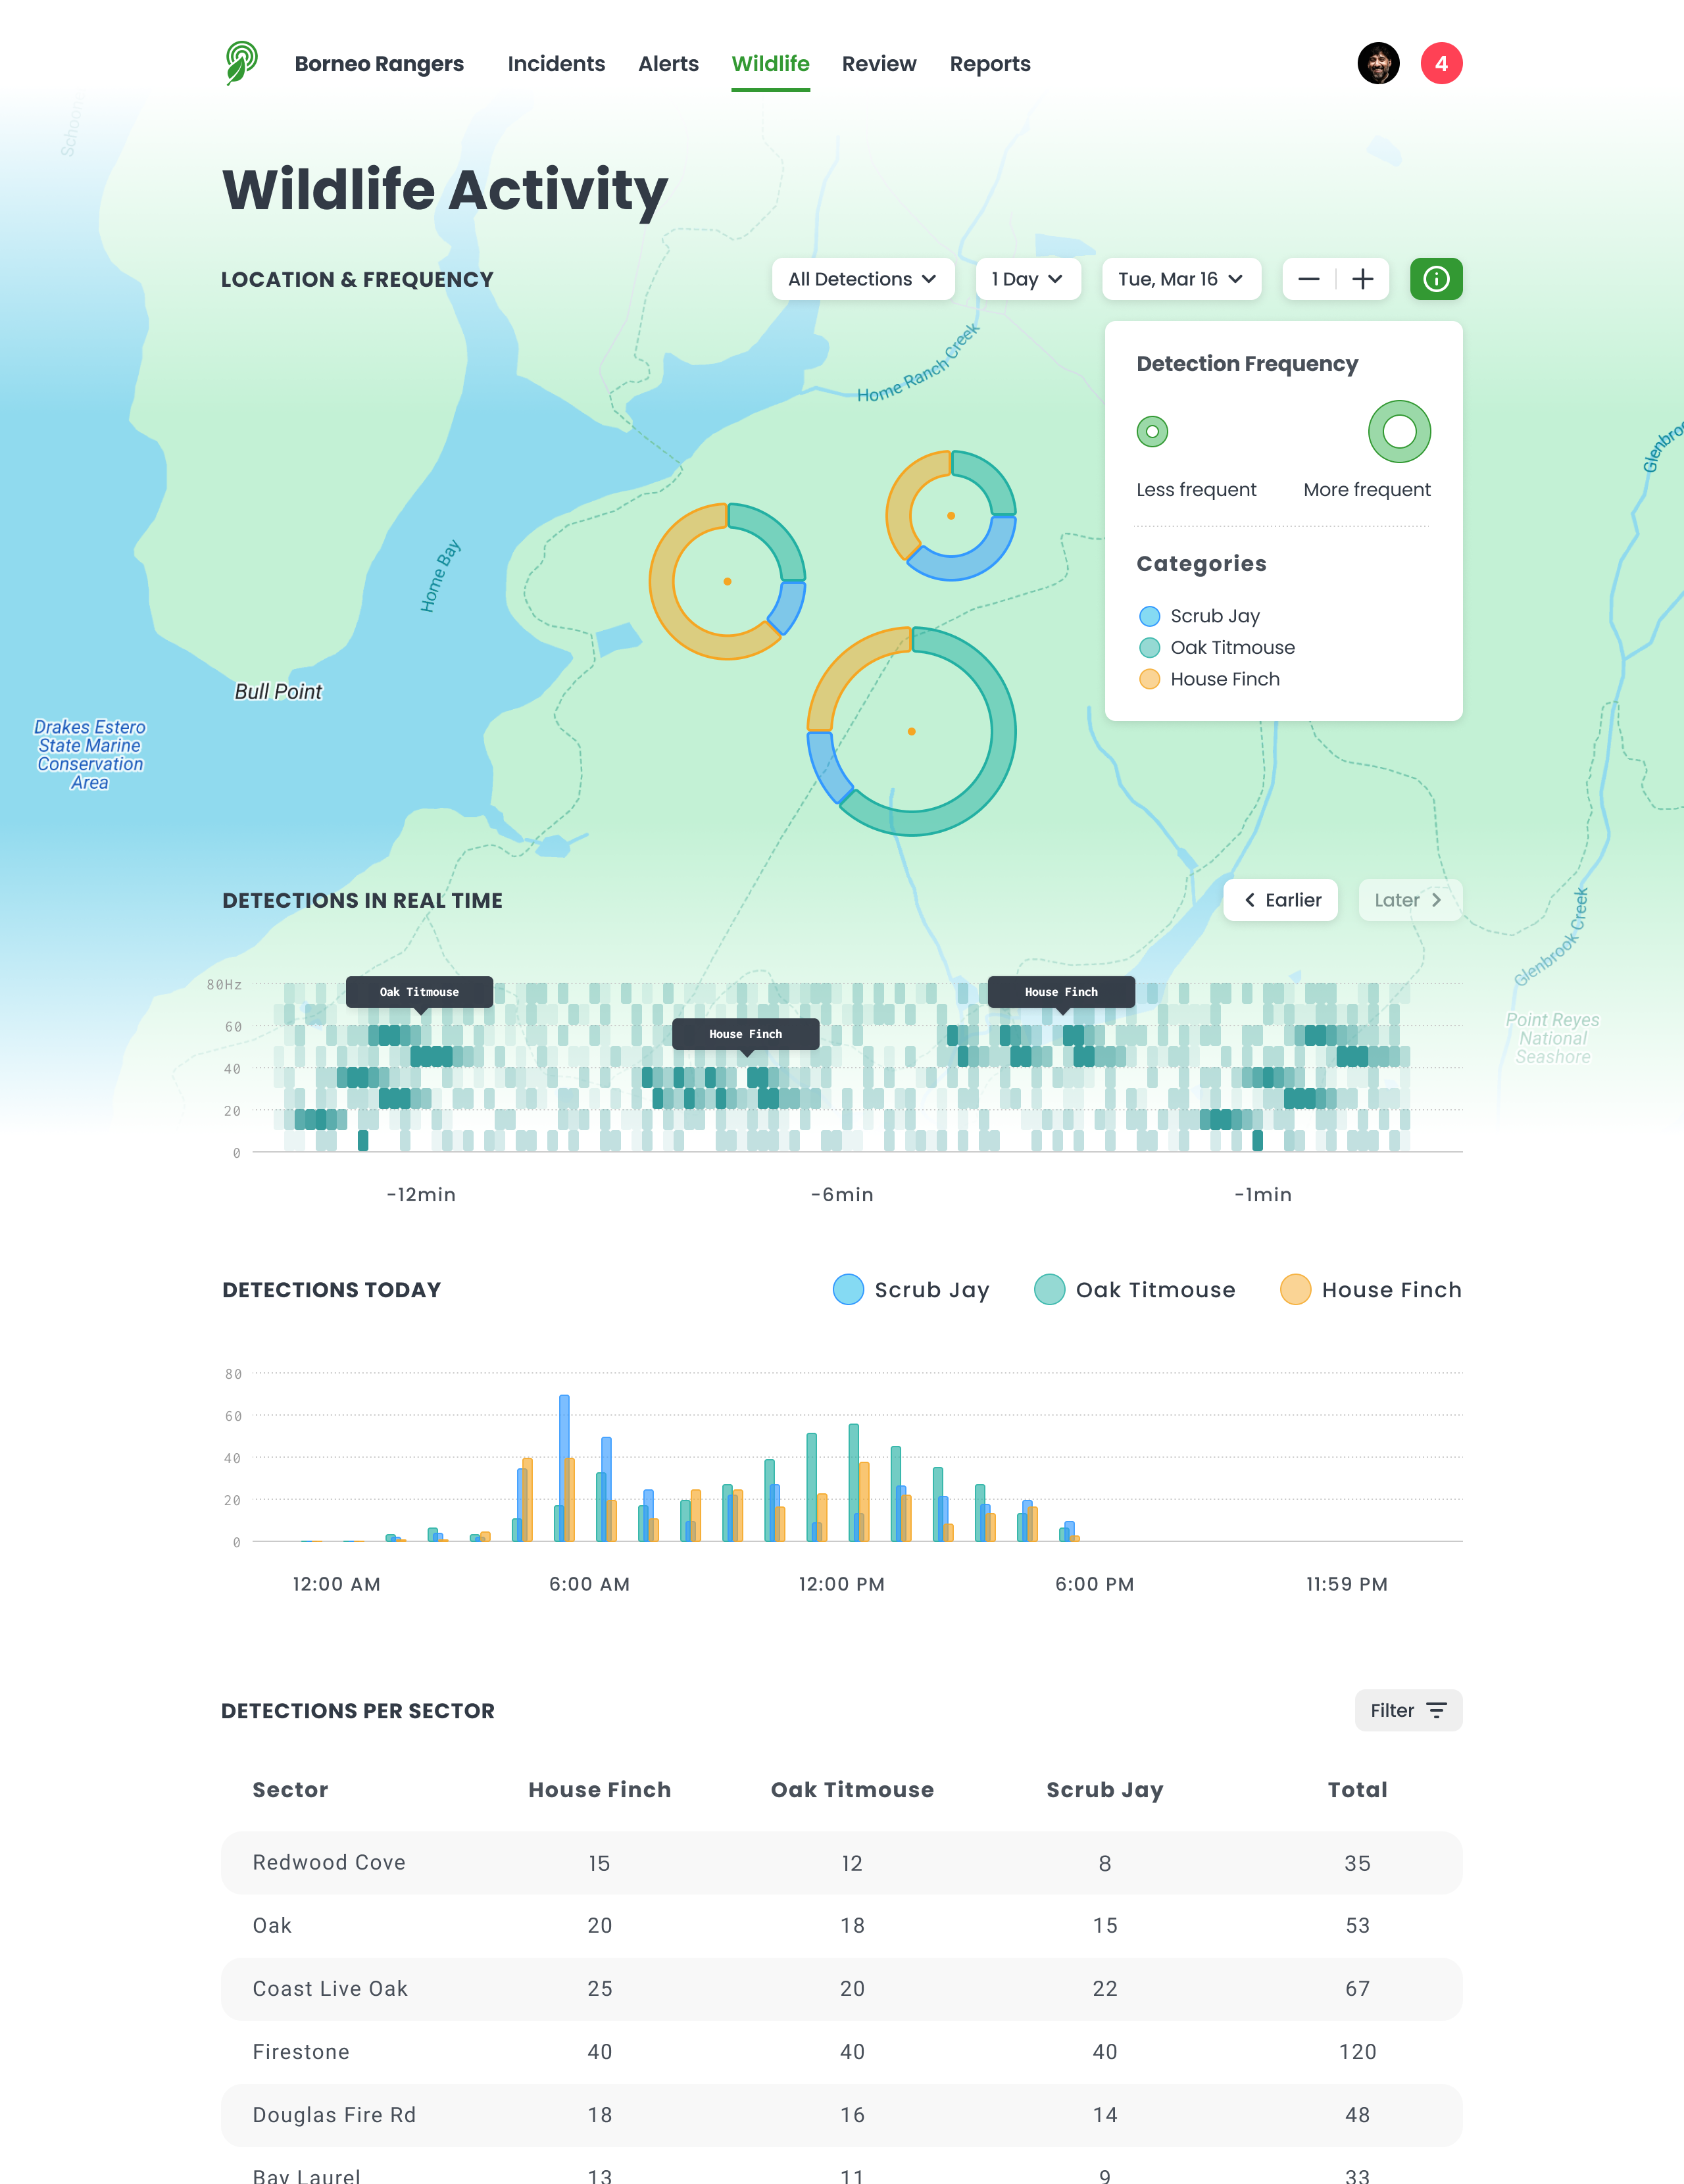
For the incident detection dashboard I used a four-color palette where each threat type had its own distinct hue. I represented detections as bubbles plotted at the geographic locations of each monitoring device (called “Guardians”), with bubble size indicating detection frequency and reduced opacity used to help distinguish between overlapping bubbles. The map used a muted topographic base with desaturated greens for terrain, ensuring the detection bubbles remained the primary focus. Grouped bar charts below the map showed detection counts over time, broken down by incident type. For the wildlife activity dashboard I used proportional donut charts overlaid on the map to represent different species detections, along with a simplified heatmap-style spectrogram with gradient blocks showing real-time acoustic activity (see Biodiversity Monitoring below).
Responsive Web Design
As the product had to be used by park rangers and scientists in the field, it was essential it could also work on mobile and tablet devices. The main challenge here was to display complex charts and tables without compromising the legibility of the content and the usability of the interface. I was able to apply relatively simple solutions, though, such as collapsable menus and table row scrolling, along with surfacing only key information, to achieve the desired results.
Biodiversity Monitoring
In addition to detecting illicit activity, the team was also developing a system for biodiversity monitoring that would support wildlife research in remote ecosystems. The platform would allow biologists and ecologists without technical expertise to train machine learning models, using RFCx’s audio dataset. Researchers could identify specific species in the data using a built-in spectrometer, then train detection models to automatically detect those species in any other audio streams. Once trained, each detection model would become available to the entire research community, creating a shared library of monitoring tools for conservationists worldwide.
Post-launch
In 2018, the company received the prestigious AI Impact Grant from Google, and our work together was featured in Google’s docuseries ‘Search On.’ RFCx has since completed projects in 35 countries worldwide, monitoring over 1 million acres of land, and its partnership with Google continues to this day. I’m proud to have been a part of this journey and to have contributed to the company’s mission.